
Page 82 - 2019_01-Haematologica-web
P. 82
A. Guy et al.
the JAK pathway (Online Supplementary Figure S1D,E). Because myeloproliferative syndromes have been described in EC-specific mouse models,23,24 we ensured that our experimental conditions did not lead to abnormal hematopoiesis. We did not observe any difference in blood cell counts in Pdgfb-iCreERT2;JAK2V617F/WT mice, sug- gesting that the hematopoietic system was not significant-
ly altered (Online Supplementary Table S1). To definitively exclude hematopoietic expression of JAK2V617F in Pdgfb- iCreERT2;JAK2V617F/WT mice, we crossed Pdgfb- iCreERT2;JAK2V617F/WT mice with mT/mG mice to generate Pdgfb-iCreERT2;JAK2V617F/WT;mT/mG mice permitting co- expression of JAK2V617F and GFP in cells after Cre-mediated excision (Online Supplementary Figure S1F). Flow cytome-
A
B
C
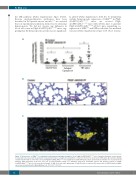
Spontaneous Collagen/ TNF-alpha Epinephrine
Figure 1. The presence of JAK2V617F in endothelial cells promotes thrombus formation. (A) In Pdgfb-iCreERT2;JAK2V617F/WT mice, thrombus formation occurs sponta- neously and is increased after weak platelet activation by low-dose collagen plus epinephrine, or injection of tumor necrosis factor (TNF)-alpha. (B) Carstairs staining of pulmonary thrombi in control mice (left) and Pdgfb-iCreERT2;JAK2V617F/WT mice (right) injected with TNF-alpha. Black arrows indicate thrombi. The clear arrow head indicates fibrin deposition. Scale bar: 500 mm. (C) Representative image of a thrombus formed by neutrophils (green) and platelets (yellow) in Pdgfb- iCreERT2;JAK2V617F/WT mice. Scale bar in the left image: 50 mM. Scale bar in the right image: 10 mM. Results are expressed as mean value ± SEM. Statistical signifi- cance was determined by the Mann-Whitney test. *P<0.05; **P<0.01.
72
haematologica | 2019; 104(1)
