
Page 204 - 2019_01-Haematologica-web
P. 204
J.S. Gandelman et al.
were classified as high risk. Patients in the high- and inter- mediate-risk groups had significantly shorter overall sur- vival than those in the low-risk group (HR=2.79; 95% CI: 1.58-4.91; P<0.001 and HR=1.78; 95% CI: 1.06-3.01; P=0.03, respectively (Figure 4). Decision-tree-determined cluster risk groups were also significantly associated with non-relapse mortality (P=0.03).
In a multivariate Cox proportional hazards model for overall survival, decision-tree-identified risk groups and platelet counts from 0-590 days were associated with sur- vival (intermediate-risk: HR=1.83; 95% CI; P=0.03, high- risk: HR=2.65; 95% CI: 1.42-4.94; P=0.002; platelet count: HR=3.10; 95% CI: 1.77-5.42; P<0.0001). NIH-Severity was not predictive of survival (moderate: HR=1.49; 95% CI: 0.66-3.38; P=0.34; severe: HR=1.71; 95% CI: 0.75-3.90; P=0.20). A model of decision-tree risk group and NIH- Severity alone showed no statistically significant interac- tion between these variables. The association between platelet counts and machine-learning-defined clusters is illustrated in Online Supplementary Figure S7.
Individual decision-tree clusters had differential disease trajectories
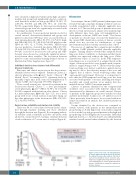
Outcomes and clinical trajectories in the decision-tree- identified clusters were compared. Patients in Cluster 2, a sclerotic phenotype with ▲Joint+7, Fascia+5, Sclerosis+4, ▼ Mouth-5, Liver-10, accounting for 10% of patients, had a sig- nificantly longer time from stem cell transplantation to chronic GvHD onset (log-rank: P<0.0001) (Figure 5).
Worse overall survival was observed for patients in the decision-tree-derived Cluster 7, a liver predominant- severe phenotype, ▲Liver+10 (HR=1.72; 95% CI: 1.01-2.93; P=0.04) compared with patients in other clusters. Cluster 6, a mixed phenotype, ▲Mouth+5 Eye+2 GI+1, was a novel group with worse overall survival, found after ruling out the other phenotypes in the decision tree (HR=1.75; 95% CI: 1.02-2.98; P=0.04).
Decision-tree reliability and cluster-risk stability
There was 86.1% concordance between clusters identi- fied through machine learning and those identified through the decision tree (Figure 6). Bootstrapping indicat- ed stability of risk coefficients in all but one cluster, with all clusters, except Cluster 3, having a standard deviation of risk coefficients <0.7 on ten runs of analysis (Figure 6).
Discussion
Seven unique chronic GvHD patients’ phenotypes were revealed through a machine-learning workflow and suc- cessfully recapitulated with a clinically applicable deci- sion-tree tool. The revealed groups of patients were strat- ified for overall survival and a unique sclerotic phenotype with different time from stem cell transplantation to development of chronic GvHD was found. The clusters of patients we describe may overcome the limitations of the current NIH classification system of disease severity which does not account for combinations of organ involvement and did not stratify survival in this cohort.
The process of applying this computational workflow to chronic GvHD patients yielded clinically applicable insights. Training analyses revealed that symptom-based lung score did not contribute to clustering and that cluster stability was improved without the lung score (Online Supplementary Figures S2 and S3). In the NIH symptom- based lung score, a score from 0-3 is assigned based on the degree of activity needed to cause dyspnea with a require- ment for oxygen being scored 3.3 The fact that this symp- tom-based lung score did not contribute to patient cluster- ing may be due to the subjective nature of the score and suggests that it reflects overall well-being rather than organ-specific involvement. However, it is important to note that the NIH symptom-based lung score has been associated with patients’ outcomes, including non-relapse mortality and overall survival, in an analysis that also included chronic GvHD Consortium patients.27
Clusters of patients identified by the computational workflow were associated with different clinical risk, demonstrated by differences in overall survival. Clusters of patients in the high-risk group were enriched for skin and liver involvement. A skin score of 3 and liver score of 3 have previously been shown to be associated with non- relapse mortality in an analysis that included patients in this cohort.10
Groups identified by the decision tree continued to stratify survival, with patients in the intermediate-risk group having a 1.8-fold higher risk of mortality compared to those in the low-risk group and patients in the high-risk group having a 2.8-fold higher risk of mortality. Individual high-risk clusters, i.e., Clusters 6 and 7, also independently stratified overall survival when identified by the decision
Figure 5. Time from stem cell transplantation to chronic graft-versus-host disease in decision tree Cluster 2 versus other clusters. Patients in decision-tree-identified Cluster 2-sclerotic phe- notype had a significantly longer time from stem cell transplantation to chronic graft-versus-host disease (cGvHD) when compared to patients in all other clusters.
194
haematologica | 2019; 104(1)
