
Page 201 - 2019_01-Haematologica-web
P. 201
Machine learning refines cGvHD classification
Machine-learning workflow
Nine organ scores were analyzed via a computational workflow consisting of visualization of t-distributed stochastic neighbor embedding (viSNE) for dimensionality reduction,18,23 self-organiz- ing maps (FlowSOM) for patient clustering24 and marker enrich- ment modeling (MEM) for feature enrichment scoring25,26 (Figure 1 and Online Supplementary Figure S1). viSNE is the visualization of an algorithm called t-distributed stochastic neighbor embedding (t-SNE). Therefore, on all viSNE maps the axes are called t-SNE1 and t-SNE2.23 The machine-learning algorithms are described in detail in the Online Supplementary Methods. NIH scores were squared prior to viSNE analysis and all scores were scaled from 0- 1. FlowSOM clustering was done using t-SNE axes. Skin erythema and sclerosis were analyzed as separate skin features in order to capture type of skin involvement by chronic GvHD.
Lung scores did not contribute to patient clustering; lung was neither enriched nor negatively enriched in MEM analysis of organ scores (Online Supplementary Figure S2). Cluster stability analyses were used to determine optimal clustering parameters (Online Supplementary Methods). Analysis with lung excluded from the workflow increased cluster stability, so lung was dropped from the analysis and eight organ scores were used (Online Supplementary Figure S3). Cluster stability with six, seven and eight clusters was tested based on the appearance of seven clusters in viSNE plots (Online Supplementary Figure S4). FlowSOM was run to identify seven clusters, based on similar but increased stability with this parameter. MEM labels are
A
reported as ▼or ▲ with OrganX where x represents a scale from -10 (most negatively enriched or ▼) to +10 (most enriched or ▲ ). Additional information on MEM and cluster stability valida- tion is provided in the Online Supplementary Methods. De-identi- fied data are available in FlowRepository (http://flowreposito- ry.org/id/FR-FCM-ZYSU).
Risk analysis
Kaplan-Meier survival and Cox proportional hazards models were used to analyze overall survival as well as time from stem cell transplantation to development of chronic GvHD. The sur- vival curve of each cluster was fitted using a Cox proportional hazards model and was compared to the survival curve of the whole cohort (Figure 2). The risk coefficient from the hazards model was used as a cluster risk score. Risk groups were stratified into low, intermediate and high based on a coefficient of risk of 0 representing the overall coefficient of risk for the whole cohort, with coefficients < -0.25 indicating low risk and coefficients >0.25 indicating high risk. Non-relapse mortality was analyzed in a com- peting-risk analysis with relapse as a competing risk. Additional information on the multivariate models is provided in the Online Supplementary Methods.
Software
Analyses were conducted using Cytobank, R software version 3.4.2 for Mac, and STATA Version 14. A seed of 42 was used for the FlowSOM analyses.
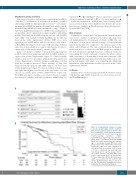
B
Figure 2. Computational analysis of organ scores reveals phenotypic clusters of patients with chronic graft-versus-host disease who were stratified for overall survival. (A) Patients were grouped into seven clusters by the machine-learning workflow (Online Supplementary Figure S1) and described using marker enrichment modeling (MEM) labels (left), which captured features enriched (▲) or specifically lacking (▼) from each group relative to the others in the cohort. Risk coefficients (right) were then calculated for each group. Risk scores below -0.25 or above 0.25 were considered low and high risk, respectively, and 0 was the average risk for the cohort. Clusters 1-3 were lower risk, Cluster 4 was intermediate risk, and Clusters 5-7 were higher risk. (B) Overall survival prob- ability was stratified for the patients with chronic graft-versus-host disease based on the low-, intermediate-, and high-risk clusters defined by the computational analysis.
haematologica | 2019; 104(1)
191
