
Page 188 - 2019_01-Haematologica-web
P. 188
C. Tromeur et al.
(Table 3), and 11 were included in the radiation exposure analysis16,18,20,21,24,28,33,34,52,54,57 (Table 4). Finally, 11 studies involving anthropometric phantoms simulating pregnan- cy were also included58-68 (Table 5).
First study endpoint: diagnostic accuracy
A total of 13 relevant studies were selected to study the rate of false negative CTPA and V-Q lung scan examina- tions.7,14-17,20,33,35,37,45,51,53,55 These studies were published between 199714 and 2017,53,55 and involved a total of 1270 patients investigated with V-Q lung scanning and 837 patients investigated with CTPA (Table 2). Data were extracted from ten full text articles7,14-17,20,33,35,37,55 and three meeting abstracts.45,51,53 Only one of these 13 studies was a prospective study in 143 patients investigated with CTPA.45 The prevalence of PE ranged between 0%20 and 22.2%,35 with the highest prevalences in the few smaller studies (median 4.1%). The duration of follow up varied from at least 3 months to 24 months.35 In two studies, the total duration of follow up was not reported.14,17 None of the 1270 patients investigated with V-Q lung scanning was diagnosed with recurrent PE or deep vein thrombosis (DVT) during follow up, resulting in a pooled number of false negative scans of 0% (95% CI: 0-0.04; I2=0.0). Three of 837 patients were diagnosed with non-fatal PE after a
normal initial CTPA, for a pooled number of false nega- tive scans of 0.0% (95% CI: 0.0-0.16; I2=5.7) in the CTPA group (Figure 2). The risk of bias was high in two stud- ies,17,51 moderate in nine studies7,14-16,20,33,35,45,53 and low in only two studies37,55 (Table 1).
Second study endpoint: non-diagnostic results
A total of 30 relevant studies were selected to evaluate
the rate of non-diagnostic or inconclusive results of V-Q lung scans or CTPA.7,14-17,19-21,23-29,32-37,45,46,49,52-57 These studies
involved a total of 2535 patients investigated with V-Q lung
scanning and 1774 patients assessed by CTPA (Table 3).
The rate of non-diagnostic results with V-Q lung scanning
ranged from 1.3%36 to 40%14 whereas the rate of non-diag-
nostic results with CTPA ranged from 0%19 to 57.1%.23,56
The rate of additional imaging tests after a first non-diag-
nostic V-Q lung scan ranged from 14%37 to 100%23,27 where-
as it ranged from 0%35 to 62%15 after a first non-diagnostic
CTPA. The pooled rates of non-diagnostic test results with
V-Q lung scanning and with CTPA were 14% (95% CI: 10-
18, I2=90.30%) and 12% (95% CI: 6-17, I2=93.86%), respec-
tively. The 95% confidence intervals of the non-diagnostic
rate values overlap (Figure 3). The risk of bias was high in 16 studies,17,19,21,24-28,32,34,36,46,49,54,56,57 moderate in 12 studies7,14-
16,20,23,29,33,35,45,52,53 and low in only two studies37,55 (Table 1).
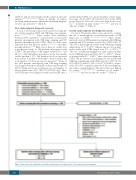
Figure 1. Flow chart of the systematic review. MA: meeting abstract; OA: original article; CUS: compression ultrasonography.
178
haematologica | 2019; 104(1)
