
Page 133 - 2019_01-Haematologica-web
P. 133
Gemtuzumab in pediatric acute myeloid leukemia
daunorubicin and fludarabine in addition to cytarabine with or without granulocyte colony stimulating factor (FLA/G+DX). Fourteen (18%) patients received HSCT prior to treatment with GO (Table 1). GO was adminis- tered after failure of treatment attempts at different time points of therapy and most (n=41, 54%) of the patients were treated with GO after failure of treatment(s) for first- early relapse of de novo AML (de novo AML, refractory to
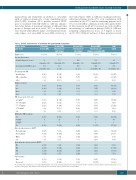
first early relapse) (Table 1). GO was equally prescribed as either monotherapy (n=36, 47%) or in combination with cytarabine (n=36, 47%), and the remaining patients (n=4, 6%) received GO in combination with other agents (Table 2). Most patients (n=48, 63%) received one cycle of GO as monotherapy or combination therapy (Table 2). GO was frequently administered at doses of 3 mg/m2 or lower (n=37, 49%) (Table 2) and most of these patients received
Table 2. Details and outcomes of treatment with gemtuzumab ozogamicin.
Disease status prior to GO
Number (%)
Age, median (range)
at initial diagnosis (years)
at treatment with GO (years)
Refractory de novo AML
10 (100)
10
(2 months -14) 10.3
(7 months -15)
De novo AML, refractory to 1st early relapse
41 (100)
7.5
(4 months -17) 8.1
(1 - 18)
De novo AML, refractory to 1st late relapse
10 (100)
12.6
(8 months - 16) 15.7
(2 - 20)
De novo AML, refractory to ≥2nd relapses/secondary AML
15 (100)
10.3
(1 month -16) 12.2
(9 months -16)
Total cohort
76 (100)
9.3
(1 month -17) 10.4
(7 months - 20)
Treatment with GO
monotherapy
GO + cytarabine
other 0(0) 4(10) 0(0) 0(0) 4(6)
Number of cycles
one 6 (60) 27 (66) 7 (70) 8 (53) 48 (63) two 4 (40) 10 (24) 3 (30) 7 (47) 24 (32) three 0(0) 3(8) 0(0) 0(0) 3(4) four 0(0) 1(2) 0(0) 0(0) 1(1)
4 (40) 6 (60)
17 (41) 20 (49)
3 (30) 7 (70)
12 (80) 3 (20)
36 (47) 36 (47)
GO dosage at the first cycle
≤3mg/m2
3.1–5.4mg/m2
5.5 - 7.5 mg/m2
>7.5mg/m2 0(0) 4(10) 2(20) 2(13) 8(10) n.d. 0(0) 2(5) 0(0) 0(0) 2(3)
6(60) 2(20) 2 (20)
Yes 8 (80) 28 (68) 8 (80) 5 (33) 49 (64) 1stHSCT 8 27 8 3 46 2ndHSCT 01023
20(49) 7(70) 4(27) 37(49) 5(12) 0(0) 1(7) 8(10) 10 (24) 1 (10) 8 (53) 21 (28)
HSCT after GO treatment
No
Extra treatment prior to HSCTa
Chemotherapy
No-treatment
Other 0(0) 1(4) 1(12) n.d. 0(0) 2(7) 0(0)
Bone marrow response prior to HSCTa
CR 2(25) CRi 2 (25) NR 3(38) n.d. 1(12)
Patient status
Alive 3 (30)
Deceased 7 (70)
1(4) 1(12) 13 (46) 2 (25) 12(43) 3(37)
2(7) 2(26) 5 (12) 5 (50)
36 (88) 5 (50)
0(0) 5(10) 2 (13) 15 (20)
13 (87) 61 (80)
2 (20)
13 (32)
2 (20)
10 (67)
1 (20) 2 (40) 1(20) 1(20)
1(20) 3 (60) 1(20)
27 (36)
14 (28) 29 (60) 3(6) 3(6)
5(10) 20 (41) 19(39)
2 (25) 6 (75)
9 (32) 16 (57)
2 (25) 5 (63)
GO: gemtuzumab ozogamicin; n.d.: no data; HSCT: hematopoietic stem cell transplantation; CR: complete remission; CRi: complete remission with incomplete hematologic recov- ery; NR: non-response. aPercentages in this category were calculated only for patients who received HSCT.
haematologica | 2019; 104(1)
123
