
Page 125 - 2019_01-Haematologica-web
P. 125
Fractionated doses of gemtuzumab ozogamicin in AML
2-sided P=0.16
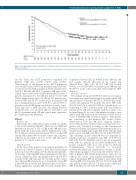
Figure 1. Overall survival. Control: daunorubicin + cytarabine (D+A); GO: gemtuzumab ozogamicin plus D+A; OS: overall survival; HR: hazard ratio; CI: Confidence Interval; n: number.
site file. Thus, the mITT population comprised 271 patients (GO arm, n=135; control arm, n=136). Characteristics of the patients in the mITT population were evenly balanced between treatment arms and were as expected in this AML population (Online Supplementary Table S1). Overall, 268 (98.9%) patients (GO arm, n=134; control arm, n=134) received study treatment; however, 3 patients randomized to the GO arm did not receive GO (Online Supplementary Figure S1). Of the 131 patients who received GO, 123 (93.9%) received all 3 fractionated GO doses during induction, and 91 (69.5%) and 64 (48.9%) patients received GO during consolidation 1 and 2, respec- tively. Exposure to DNR and AraC was similar between treatment arms over all study phases, with 62.6% and 65.0% of patients in the GO and control arms, respective- ly, completing study treatment.
Efficacy
Response rate
Overall, the rate of CR with or without CRp was similar to the results initially published.6 There was no significant difference in the rate of CR or CRp in the GO arm com- pared with the control arm (Online Supplementary Table S2). A CR was achieved in 95 patients (70.4%) in the GO arm and 95 patients (69.9%) in the control arm; CRp was achieved in 15 patients (11.1%) in the GO arm and 5 patients (3.7%) in the control arm.
Overall survival
At the time of the primary study analysis performed at the data cut-off date of August 1, 2011, the overall median follow up was 14.8 months; 20.0 months in alive patients. At the time of the final OS analysis performed at the data cut off of April 30, 2013, the median follow up was 47.6 months in the GO arm and 41.0 months in the control arm. The final OS analysis shows a numerically longer OS in the GO arm; however, this difference did not reach sta- tistical significance. Median OS was 27.5 months [95%
Confidence Interval (CI): 21.4-45.6] in the GO arm and 21.8 months (95%CI: 15.5-27.4) in the control arm [Hazard Ratio (HR), 0.81; 95%CI: 0.60-1.09; 2-sided P=0.16). A total of 80 (59.3%) patients in the GO arm and 88 (64.7%) in the control arm died before April 30, 2013 (Figure 1).
Event-free survival
The primary end point of EFS derived from investigator assessment was significantly longer for patients in the GO arm [median 17.3 months (95%CI: 13.4-30.0)] than in the control arm [median 9.5 months (8.1-12.0); HR: 0.56; 95%CI: 0.42-0.76; 2-sided P=0.0002 by log-rank test], cor- responding to a 44% reduction in the risk of an event for patients in the GO arm compared with those in the con- trol arm (Figure 2). At year 1, the number needed to treat (NNT) with GO to prevent an event was 6; NNT at year 3 was 4. Multiple EFS sensitivity analyses demonstrate the robustness of the primary EFS results (Online Supplementary Table S3). Of note, subgroup analyses showed that patients with favorable or intermediate cyto- genetic risk (classified according to the International System for Human Cytogenetic Nomenclature criteria7) at baseline had significantly longer EFS in the GO arm than in the control arm (HR: 0.46; 95%CI: 0.31-0.68; P<0.0001). This advantage in EFS with GO was not apparent for patients with poor cytogenetic risk (HR: 1.11; 95%CI: 0.63-1.95; P=0.72). Similarly, activity was more apparent with GO for patients in favorable/intermediate risk groups compared with poor risk group by National Comprehensive Cancer Network or European LeukemiaNet (ELN) risk classifications. Results of all the other subgroup analyses were consistent with the effect of GO on primary EFS (Online Supplementary Figure S2). In addition, the results of the blinded independent review support the primary EFS by investigator assessment, with a median EFS of 13.6 months (95%CI: 9.0-19.2) in the GO arm and 8.5 months (95%CI: 7.5-12.0) in the control arm (HR: 0.66; 95%CI: 0.49-0.89; P=0.006) (Table 1).
haematologica | 2019; 104(1)
115
