
Page 99 - 2018_11-Haematologica-web
P. 99
TFR after 2-year nilotinib consolidation
3-year treatment-free survival, 75.6 versus 48.6%; P=0.0126 by the log-rank test) (Figure 1C). There were no significant differences in the treatment-free survival curves between subgroups based on TKI treatment prior to the consolida- tion phase by nilotinib (‘imatinib only’ versus ‘nilotinib fol- lowing imatinib’ group, P=0.9508 by the log-rank test), presence of TKI withdrawal syndrome (P=0.4096 by the log-rank test), or absolute number of natural killer cells (≥ median versus < median, P=0.4527 by the log-rank test).
Response to nilotinib treatment re-initiation
Nilotinib was readministered to all 29 patients with a molecular recurrence during the TFR phase. After recom- mencing treatment, MR4.5 rapidly returned in 25 patients (86.2%), with 50% of patients achieving MR4.5 within 3.5 months (Figure 1D). Four out of 29 patients discontinued treatment: one patient discontinued at 1 month because of a nilotinib-associated rash, one at 2.5 months following the patient’s request, and two at 10 and 11 months because of increasing BCR-ABL1IS. Despite discontinuation of the study, all patients, including the two patients with increas- ing BCR-ABL1IS during the re-treatment phase, achieved DMR. The clinical course details of these four patients are shown in Online Supplementary Figure S1. Among 29 patients with a molecular recurrence, 16 had lost their
MMR at the first or second assessment of BCR-ABL1IS using RQ-PCR during the TFR phase. After starting treat- ment again, a MMR rapidly returned in all 16 patients (100%) in 3 months and 50% of patients achieved the MMR within 2 months (Figure 1E).
Safety, vascular adverse events, and tyrosine kinase inhibitor withdrawal syndrome
No patients progressed to accelerated phase or blast cri- sis CML, or died during this study. Adverse events (all grades) were reported in 55 patients (57.3%) in the safety analysis set in the consolidation phase, and 30 patients (38.7%) in the full analysis set in the TFR phase; the inci- dence of grade 3/4 adverse events was 14.6%, and 2.6% in the safety analysis set and full analysis set, respectively (Online Supplementary Table S2).
Vascular adverse events of any grade were reported in six patients (6.2%) during the nilotinib consolidation phase (Table 4). Ischemic heart disease (acute coronary syndrome or angina pectoris) was reported in three patients and cere- bral infarctions in three patients, but peripheral arterial occlusive disease was not reported in any patient. Among the six patients with vascular adverse events, four had at least one traditional risk factor for such events (e.g., hyper- tension, hyperlipidemia, diabetes mellitus, smoking, or
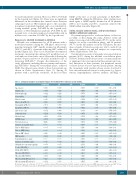
Table 3. Univariate analysis of predictive factors for treatment-free remission at 12 months.
Coefficient SE DF P-value OR
95% CI
0.980–1.055
0.913–1.013
0.945–1.033
0.511–3.808
0.997–1.019
0.629–1.216
0.808–1.054
0.945–1.134
0.764–1.061
0.187–1.916
0.297–2.201
0.240–3.297
0.377–6.248
1.000–1.000
0.998–1.001
0.999–1.001
0.997–1.029
0.138-0.998
1.000–1.000
0.988–1.026
0.984–1.004
0.905–1.033
0.921–1.039
0.997–1.001
0.931–1.033
0.939–1.019
0.960–1.018
Age (years)
Height (cm)
Body weight (kg)
Comorbidity
Platelet count
Blast cells in PB (%)
Eosinophils in PB (%)
Basophils in PB (%)
Spleen size (cm)
Sokal risk (low)
Hasford (low)
0.0168 0.0190 1 0.3769 1.017
-0.0387 0.0265 1 0.1447 0.962
-0.0122 0.0226 1 0.5876 0.988
0.3325 0.5125 1 0.5165 1.395
0.0083 0.0055 1 0.1322 1.008
-0.1340 0.1683 1 0.4259 0.875
-0.0803 0.0680 1 0.2379 0.923
0.0343 0.0466 1 0.4612 1.035
-0.1052 0.0839 1 0.2099 0.900
-0.5124 0.5933 1 0.3878 0.599
-0.2131 0.5112 1 0.6768 0.808
-0.1178 0.6687 1 0.8602 0.889
0.4283 0.7163 1 0.5499 1.535
0.0000 0.0002 1 0.8169 1.000
-0.0005 0.0009 1 0.5240 0.999
0.0001 0.0004 1 0.6993 1.000
0.0126 0.0082 1 0.1227 1.013
-0.9966 0.5025 1 0.0473 0.369
0.0000 0.0000 1 0.3515 1.000
0.0066 0.0097 1 0.4956 1.007
-0.0056 0.0051 1 0.2713 0.994
-0.0335 0.0338 1 0.3207 0.967
-0.0221 0.0306 1 0.4714 0.978
-0.0010 0.0013 1 0.4305 0.999
-0.0191 0.0265 1 0.4723 0.981
-0.0220 0.0208 1 0.2915 0.978
-0.0112 0.0150 1 0.4527 0.989
EUTOS (low)
Prior interferon-a
Duration of imatinib (days)
Time to CCyR (days)
Time to MMR (days)
Time to MR4.5 (days)
MRD positive
Total nilotinib dose (mg)
Duration of nilotinib (days)
Nilotinib dose intensity (mg/day)
T cells (CD3+CD8+)
T-LGL (CD3+CD57+)
NK cells (CD3-CD56+)
NK cells (CD16+CD56+)
NK cell activity E/T ratio 10:1
NK cell activity E/T ratio 20:1
SE: standard error; OR: odds ratio; 95% CI: 95% confidence interval; PB: peripheral blood; CCyR: complete cytogenetic response; MMR: major molecular response; MR4.5: 4.5-log reduction of BCR-ABL1 transcripts by IS-PCR; MRD: molecular residual disease; T-LGL: T-cell large granular lymphocytes; NK: natural killer; E/T: effector-target cell.
haematologica | 2018; 103(11)
1839
