
Page 138 - 2018_11-Haematologica-web
P. 138
A. Nikkilä et al.
drome was found to suggest effect modification (interac- tion P=0.99).
When the oldest possible CT scanner (at maximum, 10 years old) at the hospital was used in dose estimation instead of the most modern CT scanner, the median cumulative RBM dose for cases was 9.71 mGy (IQR 7.09 – 18.7) and for controls 7.14 mGy (IQR 5.71 – 12.6), with an excess OR of 0.11 (95% CI: 0.02 – 0.22) per mGy.
When the cumulative RBM dose from terrestrial gamma radiation and Chernobyl fallout was included in the model, the OR for cumulative RBM dose from pedi- atric CT scans remained unchanged. The median cumula- tive dose from residential gamma radiation was 1.96 mSv for cases and 1.90 mSv for controls.
The distributions of cities of the last addresses of cases and controls were analyzed to evaluate whether cases and controls belonged to catchment populations of differ- ent hospitals, which might have caused differential mis- classification due to contrasting data availability. No dif- ference in the distributions was noted (chi-squared test, P=0.30). The age and CT scan years of the subjects are reported in Online Supplementary Table S3.
Discussion
We estimated the impact of radiation exposure from pediatric CT scans on risk of childhood leukemia in a nationwide register-based case-control study in Finland. Overall, a statistically significant increase in risk per mGy of RBM absorbed dose was found. The central estimate is larger than in previous studies, but the confidence inter- vals overlap with earlier results, and the effect size is compatible with extrapolation from high-dose studies. The higher main point estimate is likely influenced by random error, as the dose estimates were imprecise due to lack of detail in dosimetric data, including parameter values used for the scanner. It is also possible that the typ- ical values based on expert opinion are representative of current procedures, but may underestimate doses from older examinations, which could inflate the risk estimates per unit dose. However, our site-specific dose estimates calculated with NCICT were quite comparable with those reported in the British study.25 We minimized the potential for systematic error by adjusting for several con- founders and used consistent procedures for the cases and controls. The risk estimates were slightly higher for pre- cursor B-cell acute lymphoblastic leukemia than for other leukemias, but the difference was not statistically signifi- cant.
Two large studies have been published on the subject prior to ours. The cohort studies from the United Kingdom and Australia reported a significant risk of child- hood leukemia associated with RBM dose from pediatric CT scans.25,26 Pearce et al. found an excess relative risk of 0.04 per mGy and Mathews et al. reported a relative risk of 1.2 for one or more CT scans with an excess relative risk of 0.04 per mGy. The Australian cohort had 211 exposed leukemia cases and the UK study 74. A smaller German cohort study reported an increased leukemia incidence following two or more CT scans, but a non-sig-
27 nificant dose-response based on 12 exposed cases. Based
on the Life Span Study in Japan, the extrapolated excess relative risk for childhood exposure would be approxi- mately 0.05 per mGy.37
Other major sources of ionizing radiation were taken into consideration by including cumulative RBM doses from terrestrial gamma radiation and Chernobyl fallout, and this did not affect the results. In our data, the average cumulative RBM dose from CT for the controls was only 0.002 mGy, which is approximately 0.1% of the average annual RBM dose in Finland.38 We accounted for medical use of radiation, to which tomography scans make the largest contribution, and terrestrial gamma radiation, which accounts for nearly two-thirds of average annual radiation to the RBM in Finland.23,39 In addition, there is little evidence to assume that other sources of ionizing radiation, such as cosmic radiation or internal exposure to natural radioisotopes, would distribute unequally among the cases and controls.
The coefficient 1.5 for incremental dose due to CT imaging with contrast medium was chosen pragmatically based on the coefficients for other body parts, as the effects on RBM dose were not reported separately.33
Based on limited population statistics available from the Radiation and Nuclear Safety Authority,23 roughly 30 CT scans were expected for the controls. However, only 13 scans were recorded among them. This might partly reflect incomplete availability of data, but the estimate of the expected numbers is highly uncertain because of lack of data on pediatric CT scans prior to 2008. It is also worth noting that pediatric CT scans are performed less frequently in Finland than in several other countries.24
Our material consists of a comprehensive set of child- hood leukemia cases and representative controls, which should eliminate selection bias by virtue of a register- based approach, which required no consent or informa- tion from the study subjects or their families. The study period covers the years in which the use of pediatric CT scans was most frequent, as the annual number of pedi- atric CT scans has been decreasing in Finland since the year 2000.23 The data on CT scans were obtained from
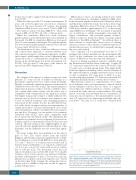
Figure 4. Dose-response curve of cumulative red bone marrow dose from pedi- atric computed tomography scans and childhood leukemia. The point esti- mates with 95% confidence intervals are for the three dose index levels and the fitted curve is for the cumulative RBM dose calculated with NCICT. The shaded area represents the 95% confidence interval for the continuous dose-response. The vertical axis is on a binary logarithm scale.
1878
haematologica | 2018; 103(11)
