
Page 124 - 2018_11-Haematologica-web
P. 124
K. Seipel et al.
are depicted as XY graphs with median and interquartile range, as box plots or scatter plots with mean values. Statistical analy- sis was done on GraphPad Prism (version 7, GraphPad software, LaJolla, CA, USA) in grouped analysis and significance calculat- ed by Mann-Whitney test. Combination indexes were calculat- ed on CompuSyn software (version 1.0; ComboSyn, Inc. Paramus, NJ,USA).
Measurement of mRNA expression by qPCR
RNA was extracted from AML cells and quantified using qPCR.
The RNA extraction kit was supplied by Macherey-Nagel, Düren, Germany. Reverse transcription was done with MMLV-RT (Promega, Madison, WI, USA). Real-time PCR was performed on the ABI7500 Real-Time PCR Instrument using ABI universal mas- ter mix (Applied Biosystems, Austin, TX, USA) and gene specific probes Hs00355782_m1 (CDKN1A), Hs01050896_m1 (MCL1) and Hs02758991_g1 (GAPDH) (ThermoFischer Scientific, Waltham, MA, USA). Measurements of CDKN1A and MCL1 expression were normalized with GAPDH values (ddCt relative quantitation). Assays were performed in three or more independ-
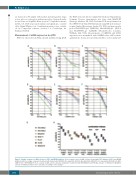
ABC
DEF
GH
Figure 1. Variable responses of AML cell lines to FLT3 and MDM2 inhibitors. Dose response curves in AML cell lines treated with FLT3 inhibitors (A,B,C) and MDM2 inhibitors (D,E,F) as single compound treatment with midostaurin (PKC412) (A), quizartinib (AC220) (B), gilteritinib (ASP2215) (C), idasanutlin (RG7833) (D), NVP- CGM097 (E) or NVP-HDM201 (F), in a variety of AML cell lines (G) and combination treatments with NVP-HDM201 and PKC412, ACC220 or ASP2215 in MOLM-13 cells (H). Combination indexes were calculated according to Chou Talalay.42
1864
haematologica | 2018; 103(11)
