
Page 116 - 2018_11-Haematologica-web
P. 116
V.V. Prassek et al.
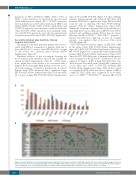
mutations in TET2, DNMT3A, SRSF2, ASXL1, TP53 or SF3B1 - genes known to be involved in age-associated clonal hematopoiesis (Figure 2B).26,27 RUNX1 mutations were positively associated with mutations in SRSF2 and ASXL1 (SRSF2, P=0.02; ASXL1, P=0.01), while ASXL1 and DNMT3A mutations were inversely correlated with each other (P=0.003). NPM1 mutations were mutually exclu- sive with RUNX1 mutations, and only two patients had co-mutations in NPM1 and ASXL1 (P<0.001) (Figure 2B).
Association between gene mutations, therapy response and survival
The number of mutated genes per patient was not asso- ciated with OS in a comparison of patients with one to three (62/151, 41%), four to seven (80/151, 53%) or eight to ten (9/151, 6%) mutated genes (P=0.6) (Online Supplementary Figure S6).
Univariate analyses of the associations between the most common gene mutations and CR rate and OS are shown in Online Supplementary Table S1. NPM1 muta- tions, which have been shown to be associated with a higher CR rate in younger AML patients, were not associ- ated with response to induction treatment in our cohort. Patients with NPM1 mutations had a significant longer EFS (P=0.027) (Online Supplementary Figure S7A) and tend- ed to have a longer RFS (P=0.081) (Online Supplementary
A
Figure S7B) and OS (P=0.090) (Figure 3A) than wildtype patients. Among patients who achieved CR, those with mutated NPM1 had a significantly longer OS (calculated from the day of achieving CR) than NPM1-wildtype patients (P=0.037) (Online Supplementary Figure S7C). Within the subgroup of patients with cytogenetically nor- mal AML, there was no difference in OS between NPM1- mutated and -wildtype patients (P=0.4, data not shown). Likewise, the OS of NPM1mutated/FLT3-ITDwildtype patients - a known favorable-risk subgroup, at least in younger patients - was similar to that of the rest of the cohort (P=0.59) (Figure 3B).
FLT3-ITD mutations had no impact on EFS, RFS, or OS in the entire cohort [EFS: P=0.54 (Online Supplementary Figure S8A); RFS: P=0.78 (Online Supplementary Figure S8B); OS: P=0.32 (Figure 3C)] or in patients with cytogenetically normal AML (P=0.26) (Online Supplementary Figure S8C). Since the FLT3-ITD allelic ratio is an important prognosti- cator recognized in the ELN 2017 classification, we also explored its impact on OS. A high FLT3-ITD allelic ratio (≥0.5) was not associated with a shorter OS compared to a low allelic ratio (<0.5) or FLT3-ITD wildtype (OS: P=0.53) (Online Supplementary Figure S8D). In the context of co-mutated NPM1, there was also no impact on OS of a high FLT3-ITD allelic ratio compared to a low allelic ratio or to NPM1mutated/FLT3-ITDwildtype patients (OS: P=0.4)
B
Figure 2. Genetic landscape of old acute myeloid leukemia patients. (A) Driver gene mutations in 151 AML patients ≥75 years of age at primary diagnosis. The bar chart shows the 15 most commonly mutated genes in the 151 AML patients aged ≥75 years compared to 664 patients aged <60 and 60-74 at primary diagnosis (data from Metzeler et al.12). (B) Heatmap showing associations between different driver gene mutations. Each column represents one patient.
1856
haematologica | 2018; 103(11)
