
Page 78 - 2018_10-Haematologica-web
P. 78
W. Zhang et al.
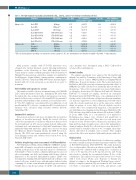
Table 1. The half maximal responding concentrations (EC
and IC 50
values)* of selinexor in leukemia cell lines.
50s
IC (mm) 50
2.89
0.03
0.06
0.09
0.08
0.08
0.06
0.12 9.18 0.03 0.03
Murine cells
Human cells
Celllines
Baf3-FLT3 Baf3-ITD Baf3-D835Y Baf3-ITD+D835Y Baf3-ITD+D835H Baf3-ITD+Y842 Baf3-ITD+F691 THP-1
Kasumi-1 MOLM13 MV4-11
FLT3status Wildtype
ITD mut**
D835Y mut ITD+D835Y mut ITD+D835H mut ITD+Y842C mut ITD+F691L mut
Wildtype Wildtype ITD mut ITD mut
EC (μm) 50
2.55
0.48
0.65
0.32
0.22
0.56
0.61
20
9.2 0.74 0.35
95%confidence interval (lower/upper)
0.66/9.73
0.30/0.77
0.40/1.04
0.07/1.50
0.04/1.30
0.16/2.01
0.17/2.23
5.02/48.19 2.87/29.38 0.21/1.53 0.21/0.61
95%confidence interval (lower/upper)
0.36/23.4
0.01/0.16
0.02/0.17
0.06/0.12
0.05/0.13
0.02/0.38
0.02/0.25
0.04/0.25 2.87/29.4 0.01/0.09 0.01/0.10
* EC50: the half maximal responding concentration to induce apoptosis; IC50: the half-maximal concentration to inhibit cell growth. ** mut: mutations
AML patients’ samples with FLT3-ITD mutations were obtained after written informed consent following institutional guidelines of the University of Texas MD Anderson Cancer Center and in accordance with the principles of the Declaration of Helsinki. The mononuclear cells in these samples were purified by Ficoll-Hypaque (Sigma-Aldrich) density-gradient centrifugation, and the cells were cultured in RPMI 1640 culture medium supple- mented with 10% fetal calf serum, as described above, prior to treatment.
Cell viability and apoptosis assays
The number of viable cells was determined using a Vi-CELL XR Cell Counter (Beckman Coulter Inc., Indianapolis IN, USA) with the trypan blue dye exclusion method, and apoptosis was deter- mined via fluorescence-activated cell sorting (FACS) by annexin V positivity and propidium iodide positivity, as described previous- ly.31 The 50% inhibitory concentration (IC50) for inhibition of cell growth and the 50% effective concentration (EC50) for induction of apoptosis were calculated using CalcuSyn software (BioSoft, Cambridge, UK).
Immunoblot analyses
Protein levels in treated cells were determined by western blot analysis, as described previously.6 Briefly, the treated cells were collected for preparation of cell lysates which were then resolved by electrophoresis on 12% precast sodium dodecyl sulfate-poly- acrylamide gels, and transferred to Hybond-P membranes. After immunoblotting with antibodies, signals were detected by using the Odyssey Infrared Imaging System (LI-COR Biosciences, Lincoln, NE, USA) and semi-quantitatively assessed using the Scion Imaging system and software (beta version 4.03; Scion, Frederick, MD, USA).
Cellular morphology and assessment of differentiation
FLT3-ITD mutated AML cell lines MOLM13, MOLM14 and pri- mary AML cell samples were plated at an initial density of 1.0×10⁵ cells/mL in the presence of the indicated agents or combinations. Following 5 to 6 days of culture, cellular morphology was assessed after cytospinning onto slides and staining with Giemsa solution. Expression of the myeloid differentiation marker CD11b was determined by staining with anti-CD11b antibody (cell lines). The stained cells were washed twice with phosphate-buffered saline containing 2% bovine serum albumin. Morphology was evaluated by light microscopy; the percentage of CD11b cells and fluores-
cence intensity were determined using a FACS Calibur flow cytometer (Becton Dickinson).
Animal studies
The animal experiments were approved by the Institutional Animal Care and Use Committee of the University of Texas, MD Anderson Cancer Center. NOD.Cg-Prkdcscid Il2rgtm1Wjl/SzJ (NOG) mice (8-week old females; n=40; The Jackson Laboratory, Bar Harbor, ME, USA) were injected intravenously with 0.5x10⁶ of MOLM13-Luci-GFP cells that were lentivirally infected with fire- fly luciferase.32 Mice (10 for each group) were treated with selinex- or (15 mg/kg, dissolved in 0.6% Pluronic F-68 and 0.6% Plasdone K-29/32) or sorafenib [10 mg/kg, dissolved in cremophor EL/ethanol/water (12.5/12.5/75)] alone, or in combination (n=10); starting on day 4 after leukemia cell injection when an unambigu- ous luciferase signal was recorded. Animals injected with vehicle (only the solvents mentioned above in the same ratios without drugs) via gavage, at a once daily x 5/week schedule, served as controls. Mice were noninvasively imaged in a Xenogen-200 in vivo bioluminescence imaging system (Xenogen, Hopkinton, MA, USA) after injection with luciferin substrate (D-luciferin, GoldBoi, St Louis, MO, USA) at a concentration of 4 mg/mouse. Bioluminescence images were obtained and quantitated as described in detail previously.6 Three mice for each group were sacrificed on day 18 after tumor cell injection, and spleen, liver, lung, and bone marrow samples were collected for immunohisto- chemical analysis. Briefly, the collected tissues were fixed in 10% neutral buffered formalin solution at 4oC overnight, then dehy- drated, embedded in paraffin, and sectioned. After antigen retrieval, the slides were incubated with anti-luciferase antibodies.
Clinical trial
We initiated a phase IB/II clinical study of selinexor in combina- tion with sorafenib in relapsed/refractory patients with FLT3-ITD or FLT3-D835 mutations (NCT02530476). The study included a dose-escalation phase IB portion in which sorafenib 400 mg BID continuously was combined with escalating doses of selinexor at a dose of 40 mg twice/week, 60 mg twice/week, and 80 mg twice/week to identify the recommended phase II dose of the combination. The selinexor was given twice/week for 3 weeks with 1 week off per 28-day cycle. Response to therapy was defined according to the International Working Group criteria.33 Briefly, a complete remission (CR) was defined as ≤5% bone mar- row blasts, a neutrophil count ≥1.0×10⁹/L, and platelet count
1644
haematologica | 2018; 103(10)
