
Page 56 - 2018_10-Haematologica-web
P. 56
C.S.G. Mirciov et al.
ABC
DE
AB
Figure 5. Circulating iron parameters and hepatic iron concentration 4 hours after iron injection in erythropoi- etin-treated mice. Six-week old male C57BL/6 mice were injected intravenously with 10 U/g body weight human erythropoietin. Five hours later, mice were intra- venously injected with either 2.5 mg/g body weight ferric citrate or an equimolar amount of citrate as sodium cit- rate. Mice were euthanized 4 h after this final injection and blood and liver tissue taken for analysis. Total serum iron (A), transferrin saturation (B), total iron bind- ing capacity (C), relative diferric transferrin levels (D) and hepatic iron concentration (E) were determined for each group. The relative diferric transferrin levels repre- sent the percentage of transferrin in the diferric form expressed as a proportion of the values in mice injected with sodium citrate but not with erythropoietin. The data represent the mean ± SEM with the number of mice in each group indicated in parentheses along the x-axis. Con: control mice injected with sodium citrate; Fe: mice injected with ferric citrate; No Epo: mice that were not injected with erythropoietin; Epo: mice that were injected with erythropoietin; Apo: apotransferrin; Mono: monoferric transferrin; Di: diferric transferrin. *P<0.05; **P<0.01; ***P<0.005.
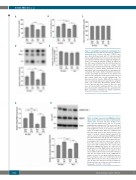
Figure 6. Hamp1 expression and SMAD phosphory- lation 4 hours after iron injection in erythropoietin- treated mice. Six-week old male C57BL/6 mice were injected intravenously with 10 U/g body weight human erythropoietin. Five hours later, mice were intravenously injected with either 2.5 mg/g body weight ferric citrate or an equimolar amount of citrate as sodium citrate. Mice were euthanized 4 h after this final injection and various tissues were taken for analysis. Hepatic Hamp1 expression (A) and the amount of phosphorylated SMAD1/5/8 (B) were determined for each group. Gene expression levels were calculated relative to the general house- keeping gene Hprt and are expressed as a propor- tion of the values in mice injected with sodium cit- rate but not with erythropoietin. The relative phos- phorylated SMAD1/5/8 levels are expressed as phosphoprotein/total SMAD1/Actin and presented in the graph as a proportion of the values in mice injected with sodium citrate but not with erythropoi- etin. The data represent the mean ± SEM with the number of mice in each group indicated in paren- theses along the x-axis. Con: control mice injected with sodium citrate; Fe: mice injected with ferric cit- rate; No Epo: mice that were not injected with ery- thropoietin; Epo: mice that were injected with ery- thropoietin. *P<0.05; ***P<0.005.
1622
haematologica | 2018; 103(10)
