
Page 53 - 2018_10-Haematologica-web
P. 53
Erythropoiesis, circulating iron and hepcidin
possibly leading to reduced diferric transferrin levels.
To determine whether circulating iron levels were indeed reduced by the increase in erythroid Tfr1 expres- sion following erythropoietin injection, we examined total serum iron and transferrin saturation at each time point. While there was a small decrease in both serum iron (Figure 3A) and transferrin saturation (Figure 3B) at 5 h, these changes were not significantly different from control values. However, TFR1 preferentially takes up diferric transferrin,16 and so any increase in TFR1-mediated iron uptake due to enhanced erythropoiesis would preferen- tially affect diferric transferrin levels. We hypothesized that the small changes in circulating iron levels seen (Figures 3A, B) might reflect larger changes in the level of circulating diferric transferrin. To test this hypothesis, we examined the various transferrin species by western blot- ting. Diferric transferrin is expressed as a proportion of total transferrin, so we first confirmed that there were no significant changes in total transferrin by examining total iron binding capacity (and hence total transferrin levels) in the samples analyzed (Figure 3C). We then demonstrated that there was a significant reduction in diferric transferrin levels at the 5 h time point (51% of the control value) (Figure 3D). This decrease was transient, with diferric transferrin returning to control levels after 12 h. As diferric transferrin has been implicated in the regulation of hep- cidin production, these results suggest that reductions in diferric transferrin levels might contribute to the decrease in Hamp1 expression following erythropoietin injection. Indeed, the decrease in diferric transferrin levels preceded the decrease in Hamp1 expression (Online Supplementary Figure S1). The significant increases in serum iron, transfer- rin saturation and diferric transferrin that were observed at the latter time points likely reflect the increase in iron
AB
release that would occur following a decrease in hepcidin production.
Intravenous injection of iron raises diferric transferrin levels without increasing hepatic iron stores
Having established that a transient reduction in diferric transferrin occurs following injection of erythropoietin, we sought to determine the consequences of increasing diferric transferrin levels during this period. To achieve this, mice were intravenously injected with a dose of ferric citrate estimated to be twice the amount required to fully saturate circulating transferrin, ensuring that transferrin was as close to saturated as possible, with any remaining non-transferrin bound iron at such low levels that it would not significantly alter tissue iron stores once removed from the circulation. Control mice were injected with an equimolar amount of citrate as sodium citrate. The iron was injected 5 h after erythropoietin administration as, at this time point, diferric transferrin was reduced whereas Hamp1 expression had not yet been affected (Figures 1A and 3D), allowing us to determine whether Hamp1 levels would decrease if diferric transferrin was elevated during the treatment period.
In order to check that the injected iron bound to circu- lating transferrin, a cohort of mice was euthanized 5 min after the iron injections. As non-transferrin bound iron is rapidly cleared from the circulation with a half-life of 30 s,23 any iron remaining in the bloodstream after 5 min should be bound to transferrin. Total serum iron (Figure 4A) and transferrin saturation (Figure 4B) were significant- ly elevated in mice injected with iron compared to those injected with sodium citrate, regardless of whether they had received a prior injection of erythropoietin, with transferrin saturations above 80% being achieved. The
CD
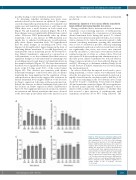
Figure 2. Tfr1 expression following erythropoietin injection in mice. Six-week old male C57BL/6 mice were euthanized 0, 5, 9, 12, 15 or 18 h following the intravenous injection of 10 U/g body weight human erythropoietin and tissues were taken for analysis. Bone marrow Tfr1 expression (A, B) and splenic Tfr1 expression (C, D) were determined for each time point. Gene expression levels were cal- culated relative to either the general housekeeping gene Hprt or the erythroid-specific marker Gypa, and are expressed as a proportion of the values at 0 h. The data represent the mean ± SEM with the number of mice in each group indicated in paren- theses along the x-axis. Statistical significance is shown relative to the 0 h group. *P<0.05; ***P<0.005.
haematologica | 2018; 103(10)
1619
