
Page 151 - 2018_10-Haematologica-web
P. 151
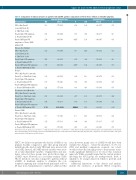
Upper GI acute GvHD adds minimal prognostic value
Table 4. Comparison of clinical outcomes in patients with aGvHD: pairwise comparisons between those without or with UGI symptoms.
Overall Survival
UGI + Skin Grade I (currently Grade II)
vs. Skin Grade I only
Grade II plus UGI symptoms vs. Grade II without UGI Grades III/IV plus UGI symptoms vs. Grades III/IV without UGI
Disease-free Survival
UGI + Skin Grade I
(currently Grade II)
vs. Skin Grade I only
Grade II plus UGI symptoms
vs. Grade II without UGI
Grades III/IV plus UGI symptoms vs. Grades III/IV without UGI Relapse
UGI + Skin Grade I (currently Grade II) vs. Skin Grade I only Grade II plus UGI symptoms
vs. Grade II without UGI
Grades III/IV plus UGI symptoms vs. Grades III/IV without UGI Treatment-related Mortality
UGI + Skin Grade I (currently Grade II) vs. Skin Grade I only Grade II plus UGI symptoms
vs. Grade II without UGI
Grades III/IV plus UGI symptoms vs. Grades III/IV without UGI Chronic GvHD
UGI + Skin Grade I (currently Grade II) vs. Skin Grade I only Grade II plus UGI symptoms
vs. Grade II without UGI
Grades III/IV plus UGI symptoms vs. Grades III/IV without UGI
Matched Related Donor HR 95% CI
1.10 0.77-1.58
1.13 0.89-1.44
1.39 1.04-1.86
1.02 0.73-1.44
1.25 0.99-1.58
1.38 1.04-1.84
1.01 0.68-1.52 1.07 0.79-1.45 1.22 0.77-1.94
1.05 0.56-1.98 1.43 0.99-2.07 1.78 1.22-2.60
P HR 0.58 1.04
0.33 0.88 0.027 1.13
0.90 1.24
0.056 0.92 0.027 1.12
0.94 1.30 0.64 0.87 0.39 0.86
0.87 1.05 0.059 1.06 0.0028 1.38
Unrelated Donor
95% CI P
0.80-1.37 0.76
0.72-1.07 0.20 0.88-1.45 0.33
0.95-1.62 0.11
0.76-1.12 0.40 0.86-1.47 0.39
0.95-1.78 0.11 0.67-1.12 0.27 0.53-1.38 0.53
0.65-1.71 0.84 0.78-1.44 0.72
1.00 0.70-1.43 1.00 1.15
0.79 0.67-1.01 0.064 0.86
1.20 0.77-1.86 0.43 0.93
0.87-1.51 0.32
0.70-1.07 0.17
0.61-1.43 0.75
0.99-1.93
0.058
Bold values indicate significance at P-value <0.01.Italicized values indicate 0.01< P-value <0.05.N.B.,Tables 3A,3B,and 4 were derived from the same multivariable model treating time of transplantation as the starting point and each GvHD-related group as a time dependent variable,although only particular comparisons are cited in each table. UGI:upper gastrointestinal. GvHD: graft-versus-host disease.
HSCT, we did not cite patients who had no aGvHD as our primary baseline comparator, since that group included individuals who died of early TRM and were never at risk of aGvHD. Instead, all GvHD-related variables were treat- ed as time-dependent variables. Kaplan-Meier and inci- dence curves for these groups were plotted from time of aGvHD onset. However, in a secondary analysis (Table 3B) we did show outcomes compared to patients without aGvHD. A landmark analysis to eliminate the con- founder/competing risk of early death performed at 30 or 60 days from transplantation could have addressed this
issue; however, many cases of aGvHD would have been excluded by doing so. Given the incidence of <3% for iUGI and multiple comparisons required, our cohort would not have had enough power to demonstrate statis- tically significant differences if we chose this statistical approach. While one might argue that the current analyses involving the iUGI group are underpowered, there is unlikely to be a larger dataset in which to perform such comparisons.
Additional limitations of this dataset and analysis include the exclusion of pediatric HSCT recipients,
haematologica | 2018; 103(10)
1717
