
Page 64 - 2018_09-Mondo
P. 64
S. Geyh et al.
comparisons the two-sided unpaired Student t-test was employed, while for intra-individual analyses the Wilcoxon signed rank test was used. For all experiments means and the standard error of mean (SEM) are given. Statistical significance was established at P≤0.05.
Data access
RNA sequencing expression data have been stored in the Gene Expression Omnibus database (GSE107490).
Results
RNA sequencing analysis of myelodysplastic syndrome- and acute myeloid leukemia-derived mesenchymal stromal cells reveals a specific gene expression profile reflecting their phenotypic
and functional deficits
We have previously shown that MSC from MDS and AML patients display common functional deficits and
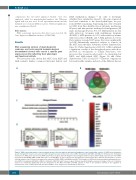
DNA methylation changes.12,13 In order to determine whether these similarities extend to the gene expression level and contribute to the altered phenotype, we per- formed RNA sequencing. Sequencing data were obtained for MSC from three healthy donors (all male, median age 68 years) and nine patients with myeloid malignancies [all male, median age 60 years, P=1.0; 3 MDS patients (n. 4-6) with refractory cytopenia with multilineage dysplasia (RCMD), 3 MDS patients (n. 9-11) with refractory anemia with excess blasts (RAEB), and 3 AML patients (n. 9-11)]. Data analysis revealed 1673 genes that were significantly (q<0.05) differentially expressed, relative to controls, in the MSC from the three subentities (Online Supplementary Figure S1, Online Supplementary Table S3). GSEA confirmed a significant overlap of the deregulated genes with those involved in osteogenesis or cellular senescence, two processes that we previously found to be deregulated in MDS- and AML-related MSC (Figure 1A and Online Supplementary Tables S4 and S5).12,13 Pairwise comparisons between healthy samples and each of the different disease
AB
CE
D
Figure 1. RNA sequencing analysis of mesenchymal stromal cells from patients with myeloid malignancies and from healthy controls. (A) GSEA plots showing the specific deregulation of gene sets associated with osteogenesis and cellular senescence in MSC from patients with MDS and AML. For both plots, the normalized enriched score (NES), false discovery rate (FDR) and P-values are given. (B) Venn diagram representing the number of genes differentially expressed (q<0.05) in MSC from patients with RCMD, RAEB or AML with respect to healthy MSC, as well as those genes deregulated in common in the three different myeloid entities. (C) Gene ontology analysis of the 112 genes deregulated in common in RCMD-, RAEB- and AML-derived MSC. (D) Examples of GSEA plots demonstrating an inflammatory reac- tion in MSC from patients with MDS or AML. For both plots, NES, FDR and P-values are given. (E) Heat map illustrating the expression changes of the set of cytokines found to be statistically significantly (q<0.05) deregulated in the MSC from MDS and AML patients. A total of 173 cytokines involved in the regulation of hematopoiesis, some of which previously described in MDS,10 were analyzed. FC: fold-change in expression.
1464
haematologica | 2018; 103(9)
