
Page 139 - 2018_09-Mondo
P. 139
Chronic GvHD, PRO and health status
data further suggest that current interventions are insuffi- cient in controlling the impact of chronic GvHD on QOL.
The fact that chronic GvHD remained a significant pre- dictor of QOL despite inclusion of comorbidities suggests that chronic GvHD is associated with additional detri- mental comorbidities or causal pathways beyond those included in the analysis. In addition to organ dysfunction and symptoms directly caused by chronic GvHD, patients with chronic GvHD require medications that often have side effects, need frequent appointments for medical mon- itoring, have functional deficits and environmental limita- tions, and suffer from frequent infections. These factors can all have a negative impact on QOL.
We found that the NIH PROMIS measures seemed to perform well in distinguishing patients who had never had chronic GvHD or whose chronic GvHD had resolved from those with mild disease and those with moderate- severe disease, suggesting that they could be used in place of the SF-36. The NIH PROMIS measures have a number of advantages over other commonly used instruments in HCT. First, they are available at no cost and feature valid translations in multiple languages. Second, the scales are available in various lengths and can be combined as need- ed allowing significant flexibility to investigators. Third, the scales can be administered with computer-assisted technology that uses item response theory to minimize
Table 3. Multivariate model of clinical characteristics predicting patient-reported outcomes.1
Factor
Age, per decade
Comorbidity burden, any
vs. none2
Chronic GvHD
Never vs. resolved Mild vs. resolved Moderate vs. resolved Severe vs. resolved
SF-36 PCS
-1.4 (-1.9, -0.9) <0.0001 -4.5 (-5.5, -3.4) <0.0001
-0.5 (-2.1, 1.1) -4.2 (-6.0, -2.4) -9.6 (-11.9, -7.2) -13.0 (-17.4, -8.7) <0.0001
SF-36 MCS
0.8 (0.3, 1.3) 0.003
-1.5 (-2.6, -0.4) 0.005
-0.4 (-1.9, 1.2) -3.0 (-4.7, -1.2) -5.8 (-8.0, -3.6) -9.0 (-13.1, -4.8) <0.0001
PROMIS-Global Physical: T score
-0.5 (-1.0, -0.02) 0.04
-3.6 (-4.6, -2.6) <0.0001
-0.8 (-2.2, 0.7) -4.3 (-6.0, -2.7) -9.6 (-11.7, -7.5) -10.8 (-14,9, -6.7) <0.0001
PROMIS-Global Mental: T score
0.1 (-0.4, 0.6) 0.76
-2.0 (-3.1, -1.0) 0.0002
-0.4 (-1.9, 1.1) -3.6 (-5.3, -1.9) -7.7 (-10.0, -5.5) -9.7 (-14.1, -5.4) <0.0001
Lee symptom scale summary
0.5 (0.05, 1.0) 0.03
2.1 (1.0, 3.1) < 0.0001
-2.3 (-3.8, -0.8) 5.3 (3.6, 7.0) 14.8 (12.6, 17.0) 14.9 (10.6, 19.2) < 0.0001
1Regression coefficients (95% CI) and associated P-values adjusted for conditioning intensity, donor type, prior relapse, sex, graft type, and total body irradiation dose. 2includes pulmonary disease, avascular necrosis, adrenal insufficiency and diabetes, from patient self-reported data
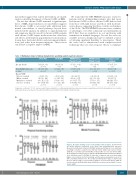
AB
C
Figure 1. Box plots showing scores on the quality of life measures. (A) Short-Form 36 (SF-36) Physical Component Score (PCS) and Patient-Reported Outcomes Measurement Information System (PROMIS) Global Health Physical score (GH-Phys), according to whether a patient never (N) had chronic GvHD, had resolved chronic GvHD (R), or currently reported mild (Mi), moderate (Mo) or severe (S) chronic GvHD. (B) SF-36 Mental Component Score (MCS) and PROMIS Global Health Health Mental score (GH-Ment), and (C) PROMIS 29 subscales of physical and social functioning. Higher scores indicate better functioning, and the general population mean is 50 with a standard deviation of 10. The median and interquartile range are depicted by the box, and the range is represented by whiskers. N: never had chronic GvHD; R: resolved chronic GvHD; M: mild chronic GvHD; Mo: moderate chronic GvHD; S: severe chronic GvHD.
haematologica | 2018; 103(9)
1539
