
Page 279 - Haematologica Vol. 109 - July 2024
P. 279
LETTER TO THE EDITOR
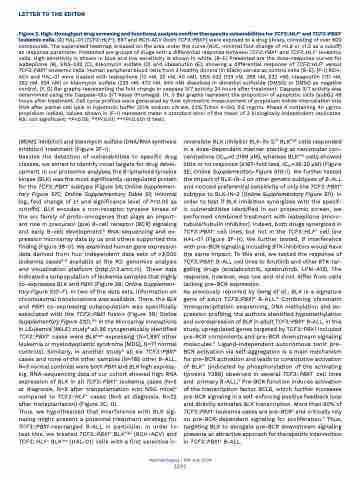
Figure 2. High-throughput drug screening and functional analysis confirm therapeutic vulnerabilities for TCF3::HLF+ and TCF3::PBX1+ leukemic cells. (A) HAL-01 (TCF3::HLF+), 697 and RCH-ACV (both TCF3::PBX1+) were exposed to a drug library, consisting of over 600 compounds. The supervised heatmap is based on the area under the curve (AUC, minimal fold change of <0.8 or >1.2 as a cutoff) as response parameter. Presented are groups of drugs with a differential response between TCF3::PBX1+ and TCF3::HLF+ leukemic cells. High sensitivity is shown in blue and low sensitivity is shown in white. (B-E) Presented are the dose-response curves for ixabepilone (B), SNS-032 (C), bleomycin sulfate (D) and idasanutlin (E), showing a differential response of TCF3::HLF+ versus TCF3::PBX1+ leukemic cells. Human peripheral blood cells from 3 healthy donors (in black) served as control cells (B-E). (F-I) RCH- ACV and HAL-01 were treated with ixabepilone (10 nM, 20 nM, 40 nM), SNS-032 (133 nM, 266 nM, 532 nM), idasanutlin (131 nM, 262 nM, 524 nM) or bleomycin sulfate (235 nM, 470 nM, 940 nM) dissolved in dimethyl sulfoxide (DMSO) or DMSO as negative control. (F, G) Bar graphs representing the fold change in caspase 3/7 activity 24 hours after treatment. Caspase 3/7 activity was determined using the Caspase-Glo 3/7 Assay (Promega). (H, I) Bar graphs represent the proportion of apoptotic cells (subG1) 48 hours after treatment. Cell cycle profiles were generated by flow cytometric measurement of propidium iodide intercalation into DNA after partial cell lysis in hypotonic buffer (0.1% sodium citrate, 0.1% Triton X-100, 0.5 mg/mL RNase A containing 40 μg/mL propidium iodide). Values shown in (F-I) represent mean ± standard error of the mean of 3 biologically independent replicates. NS: not significant; *P<0.05; **P<0.01; ***P<0.001 (t test).
(MDM2 inhibitor) and bleomycin sulfate (DNA/RNA synthesis inhibitor) treatment (Figure 2F-I).
Besides the detection of vulnerabilities to specific drug classes, we aimed to identify novel targets for drug devel- opment. In our proteomic analyses, the B-lymphoid tyrosine kinase (BLK) was the most significantly upregulated protein for the TCF3::PBX1+ subtype (Figure 3A; Online Supplemen- tary Figure S1C; Online Supplementary Table S1; minimal log2 fold change of ±1 and significance level of P<0.05 as cutoffs). BLK encodes a non-receptor tyrosine kinase of the src family of proto-oncogenes that plays an import- ant role in precursor (pre) B-cell receptor (BCR) signaling and early B-cell development.5 RNA-sequencing and ex- pression microarray data by us and others supported this finding (Figure 3B-D). We examined human gene expression data derived from four independent data sets of >3,000 leukemia cases6-9 available at the R2: genomics analysis and visualization platform (http://r2.amc.nl). These data indicated a subpopulation of leukemia samples that highly co-expresses BLK and PBX1 (Figure 3B; Online Supplemen- tary Figure S1D-F). In two of the data sets, information on chromosomal translocations was available. There, the BLK and PBX1 co-expressing subpopulation was specifically associated with the TCF3::PBX1 fusion (Figure 3B; Online Supplementary Figure S1D).8,9 In the Microarray Innovations in LEukemia (MILE) study8 all 36 cytogenetically identified TCF3::PBX1+ cases were BLKhigh expressing (N=1,897 other leukemia or myelodysplastic syndrome [MDS], N=71 normal controls). Similarly, in another study9 all six TCF3::PBX1+ cases and none of the other samples (N=185 other B-ALL, N=3 normal controls) were both PBX1 and BLK high express- ing. RNA-sequencing data of our cohort showed high RNA expression of BLK in all TCF3::PBX1+ leukemia cases (N=5 at diagnosis, N=8 after transplantation into NSG mice)2 compared to TCF3::HLF+ cases (N=5 at diagnosis, N=22 after transplantation) (Figure 3C, D).
Thus, we hypothesized that interference with BLK sig- naling might present a potential treatment strategy for TCF3::PBX1-rearranged B-ALL in particular. In order to test this, we treated TCF3::PBX1+ BLKhigh (RCH-ACV) and TCF3::HLF+ BLKlow (HAL-01) cells with a first selective ir-
reversible BLK inhibitor BLK-IN-2.10 BLKhigh cells responded in a dose-dependent manner starting at nanomolar con- centrations (IC50=0.2169 μM), whereas BLKlow cells showed little or no response (≥167-fold less, IC50=36.20 μM) (Figure 3E; Online Supplementary Figure S1G-I). We further tested the impact of BLK-IN-2 on other genetic subtypes of B-ALL and noticed preferential sensitivity of only the TCF3::PBX1+ subtype to BLK-IN-2 (Online Supplementary Figure S1I). In order to test if BLK inhibition synergizes with the specif- ic vulnerabilities identified in our proteomic screen, we performed combined treatment with ixabepilone (micro- tubule/tubulin inhibitor). Indeed, both drugs synergized in TCF3::PBX1+ cell lines, but not in the TCF3::HLF+ cell line HAL-01 (Figure 3F-H). We further tested, if interference with pre-BCR signaling including BTK inhibitors would have the same impact. To this end, we tested the response of TCF3::PBX1+ B-ALL cell lines to ibrutinib and other BTK-tar- geting drugs (acalabrutinib, spebrutinib, LFM-A13). The response, however, was low and did not differ from cells lacking pre-BCR expression.
As previously reported by Geng et al., BLK is a signature gene of adult TCF3::PBX1+ B-ALL.9 Combining chromatin immoprecipitation sequencing, DNA methylation and ex- pression profiling, the authors identified hypomethylation and overexpression of BLK in adult TCF3::PBX1+ B-ALL. In this study, upregulated genes targeted by TCF3::PBX1 included pre-BCR components and pre-BCR downstream signaling molecules.11 Ligand-independent autonomous tonic pre- BCR activation via self-aggregation is a main mechanism for pre-BCR activation and leads to constitutive activation of BLK11 (indicated by phosphorylation of the activating tyrosine Y388) observed in several TCF3::PBX1+ cell lines and primary B-ALL.11 Pre-BCR function induces activation of the transcription factor BCL6, which further increases pre-BCR signaling in a self-enforcing positive feedback loop and directly activates BLK transcription. More than 90% of TCF3::PBX1+ leukemia cases are pre-BCR+ and critically rely on pre-BCR-dependent signaling for proliferation.5 Thus, targeting BLK to abrogate pre-BCR downstream signaling presents an attractive approach for therapeutic intervention in TCF3::PBX1+ B-ALL.
Haematologica | 109 July 2024
2293
