
Page 218 - Haematologica Vol. 109 - July 2024
P. 218
ARTICLE - Carfilzomib, thalidomide and dexamethasone (KTd) in RRMM S. Ninkovic et al.
Results
Patients and treatment
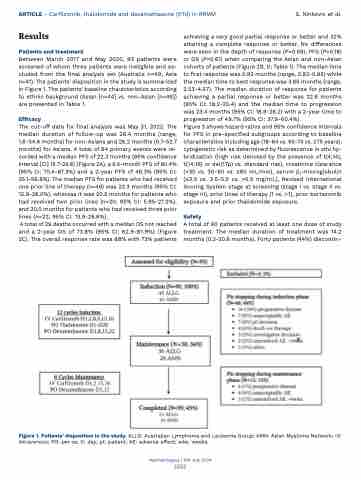
Between March 2017 and May 2020, 93 patients were screened of whom three patients were ineligible and ex- cluded from the final analysis set (Australia n=49; Asia n=41). The patients’ disposition in the study is summarized in Figure 1. The patients’ baseline characteristics according to ethnic background (Asian [n=44] vs. non-Asian [n=46]) are presented in Table 1.
Efficacy
The cut-off date for final analysis was May 31, 2022. The median duration of follow-up was 26.4 months (range, 1.6-54.6 months) for non-Asians and 26.2 months (0.7-52.7 months) for Asians. A total of 64 primary events were re- corded with a median PFS of 22.3 months (95% confidence interval [CI] 15.7-25.6) (Figure 2A), a 6.5-month PFS of 80.4% (95% CI: 70.4-87.3%) and a 2-year PFS of 46.3% (95% CI: 35.1-56.8%). The median PFS for patients who had received one prior line of therapy (n=48) was 22.3 months (95% CI: 12.9-26.0%), whereas it was 20.5 months for patients who had received two prior lines (n=20; 95% CI: 5.95-27.2%), and 20.0 months for patients who had received three prior lines (n=22; 95% CI: 13.9-28.6%).
A total of 29 deaths occurred with a median OS not reached and a 2-year OS of 73.8% (95% CI: 62.9-81.9%) (Figure 2C). The overall response rate was 88% with 73% patients
achieving a very good partial response or better and 32% attaining a complete response or better. No differences were seen in the depth of response (P=0.69), PFS (P=0.18) or OS (P=0.61) when comparing the Asian and non-Asian cohorts of patients (Figure 2B, D; Table 1). The median time to first response was 0.92 months (range, 0.92-0.95) while the median time to best response was 3.65 months (range, 2.53-4.57). The median duration of response for patients achieving a partial response or better was 22.6 months (95% CI: 18.2-25.4) and the median time to progression was 23.4 months (95% CI: 18.9-26.2) with a 2-year time to progression of 49.7% (95% CI: 37.9-60.4%).
Figure 3 shows hazard ratios and 95% confidence intervals for PFS in pre-specified subgroups according to baseline characteristics including age (18-64 vs. 65-74 vs. ≥75 years), cytogenetic risk as determined by fluorescence in situ hy- bridization (high risk denoted by the presence of t(4;14), t(14;16) or del(17p) vs. standard risk), creatinine clearance (<30 vs. 30-60 vs. ≥60 mL/min), serum b2-microglobulin (≤3.5 vs. 3.5-5.5 vs. >5.5 mg/mL), Revised International Scoring System stage at screening (stage I vs. stage II vs. stage III), prior lines of therapy (1 vs. >1), prior bortezomib exposure and prior thalidomide exposure.
Safety
A total of 90 patients received at least one dose of study treatment. The median duration of treatment was 14.2 months (0.2-20.6 months). Forty patients (44%) discontin-
Figure 1. Patients’ disposition in the study. ALLG: Australian Lymphoma and Leukemia Group; AMN: Asian Myeloma Network; IV: intravenous; PO: per os; D: day; pt: patient; AE: adverse effect; wks: weeks.
Haematologica | 109 July 2024
2232
