
Page 201 - Haematologica Vol. 109 - July 2024
P. 201
ARTICLE - FLT3L promotes osteolysis in multiple myeloma
D. Shin et al.
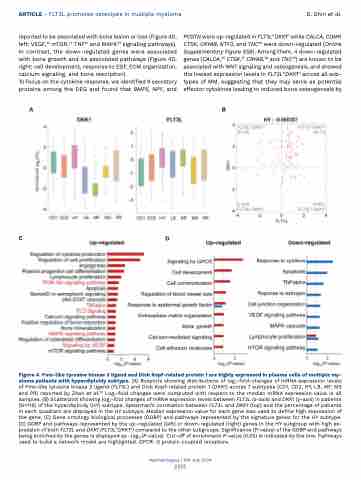
reported to be associated with bone lesion or loss (Figure 4D, left: VEGF,32 mTOR,33 TNF10 and MAPK34 signaling pathways). In contrast, the down-regulated genes were associated with bone growth and its associated pathways (Figure 4D, right: cell development, response to EGF, ECM organization, calcium signaling, and bone resorption).
To focus on the cytokine response, we identified 9 secretory proteins among the DEG and found that BMP5, NPY, and
POSTN were up-regulated in FLT3LHDKK1H while CALCA, COMP, CTSK, CRYAB, NTF3, and TNC35 were down-regulated (Online Supplementary Figure S5B). Among them, 4 down-regulated genes (CALCA,36 CTSK,37 CRYAB,38 and TNC35) are known to be associated with WNT signaling and osteogenesis, and showed the lowest expression levels in FLT3LHDKK1H across all sub- types of MM, suggesting that they may serve as potential effector cytokines leading to reduced bone osteogenesis by
AB
CD
Figure 4. Fms-like tyrosine kinase 3 ligand and Dick Kopf-related protein 1 are highly expressed in plasma cells of multiple my- eloma patients with hyperdiploidy subtype. (A) Boxplots showing distributions of log2-fold-changes of mRNA expression levels of Fms-like tyrosine kinase 3 ligand (FLT3L) and Dick Kopf-related protein 1 (DKK1) across 7 subtypes (CD1, CD2, HY, LB, MF, MS and PR) reported by Zhan et al.50 Log2-fold changes were computed with respect to the median mRNA expression value in all samples. (B) Scatterplot showing log2-fold changes of mRNA expression levels between FLT3L (x-axis) and DKK1 (y-axis) in patients (N=116) of the hyperdiploidy (HY) subtype. Spearman’s correlation between FLT3L and DKK1 (top) and the percentage of patients in each quadrant are displayed in the HY subtype. Median expression value for each gene was used to define high expression of the gene. (C) Gene ontology biological processes (GOBP) and pathways represented by the signature genes for the HY subtype. (D) GOBP and pathways represented by the up-regulated (left) or down-regulated (right) genes in the HY subgroup with high ex- pression of both FLT3L and DKK1 (FLT3LHDKK1H) compared to the other subgroups. Significance (P-value) of the GOBP and pathways being enriched by the genes is displayed as -log10(P-value). Cut-off of enrichment P-value (0.05) is indicated by the line. Pathways used to build a network model are highlighted. GPCR: G protein coupled receptors.
Haematologica | 109 July 2024
2215
