
Page 176 - Haematologica Vol. 109 - July 2024
P. 176
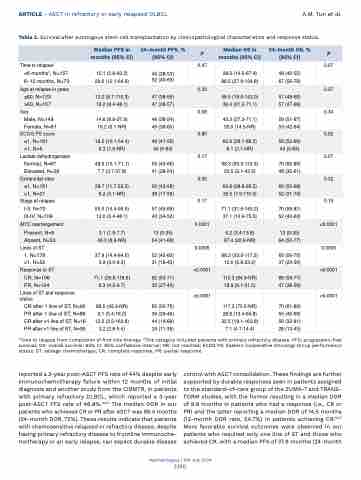
ARTICLE - ASCT in refractory or early relapsed DLBCL A.M. Tun et al. Table 2. Survival after autologous stem cell transplantation by clinicopathological characteristics and response status.
  Median PFS in 24-month PFS, % P Median OS in 24-month OS, % P months (95% CI) (95% CI) months (95% CI) (95% CI)
 Time to relapse†
<6 months‡, N=157 6–12 months, N=73
10.1 (5.8-43.3) 29.6 (12.1-64.9)
0.47
28.0 (14.5-67.4) 88.5 (37.8-134.8)
48 (40-55) 67 (56-78)
0.07
45 (38-53) 52 (40-63)
Age at relapse in years 0.33 0.37
 ≤60, N=123 12.2 (6.7-110.3) 47 (38-56) 48.5 (18.9-143.0) 57 (48-66)
>60, N=107 16.2 (8.4-48.1) 47 (38-57) 39.4 (21.2-71.1) 57 (47-66)
Sex 0.08 0.34
 Male, N=149 14.6 (8.9-37.9) 46 (38-54) 43.3 (27.3-71.1) 59 (51-67)
Female, N=81 16.2 (6.1-NR) 49 (38-60) 55.0 (14.5-NR) 53 (42-64)
ECOG PS score 0.80 0.52
 ≤1, N=181 18.5 (10.1-54.4) 49 (41-56) 62.9 (28.1-88.5) 59 (52-66)
>1, N=5 6.3 (1.6-NR) 40 (0-83) 8.1 (2.1-NR) 40 (0-83)
Lactate dehydrogenase 0.17 0.07
 Normal, N=87 48.9 (10.1-71.1) 55 (45-66) 68.3 (55.0-110.3) 70 (60-80)
Elevated, N=56 7.7 (3.7-37.8) 41 (28-54) 20.5 (9.1-43.3) 48 (35-61)
Extranodal sites 0.50 0.32
 ≤1, N=161 28.7 (11.7-59.5) 50 (43-58) 64.8 (28.8-95.5) 60 (53-68)
>1, N=21 8.2 (3.1-NR) 38 (17-59) 32.5 (7.9-110.3) 52 (31-74)
Stage at relapse 0.17 0.15
 I-II, N=70 55.0 (14.4-95.5) 57 (45-69) 71.1 (31.5-145.2) 70 (59-81)
III-IV, N=109 12.0 (5.4-48.1) 43 (34-52) 37.1 (13.9-75.5) 52 (43-62)
 MYC rearrangement 0.0001 <0.0001
Present, N=9 3.1 (1.9-7.7) 13 (0-35) 6.2 (3.4-13.8) 13 (0-35)
Absent, N=53 43.3 (8.9-NR) 54 (41-68) 67.4 (22.9-NR) 64 (50-77)
Lines of ST 0.0005 0.0005
 1, N=178 37.9 (14.4-84.0) 52 (45-60) 68.3 (33.0-117.2) 63 (56-70)
>1, N=52 3.9 (3.0-9.3) 31 (18-43) 12.0 (6.8-23.2) 37 (23-50)
Response to ST <0.0001 <0.0001
 CR, N=106 71.1 (29.6-118.6) 62 (53-71) 110.3 (64.9-NR) 68 (59-77)
PR, N=124 6.3 (4.2-9.7) 35 (27-43) 18.9 (9.1-31.5) 47 (38-56)
 Lines of ST and response status
<0.0001 <0.0001
CR after 1 line of ST, N=90 88.5 (43.3-NR) 65 (55-75) 117.2 (75.5-NR) 70 (61-80)
PR after 1 line of ST, N=88 9.1 (5.4-16.2) 39 (29-49) 28.8 (13.4-64.8) 55 (45-66)
CR after >1 line of ST, N=16 12.0 (3.5-163.8) 44 (19-68) 32.5 (19.1-163.8) 56 (32-81)
PR after >1 line of ST, N=36 3.2 (2.8-5.4) 25 (11-39) 7.1 (4.7-14.4) 28 (13-43)
        †Time to relapse from completion of first-line therapy. ‡This category included patients with primary refractory disease. PFS: progression-free survival; OS: overall survival; 95% CI: 95% confidence interval; NR: not reached; ECOG PS: Eastern Cooperative Oncology Group performance status; ST: salvage chemotherapy; CR: complete response; PR: partial response.
reported a 3-year post-ASCT PFS rate of 44% despite early immunochemotherapy failure within 12 months of initial diagnosis and another study from the CIBMTR, in patients with primary refractory DLBCL, which reported a 3-year post-ASCT PFS rate of 46.8%.10,25 The median DOR in our patients who achieved CR or PR after ASCT was 96.4 months (24-month DOR, 72%). These results indicate that patients with chemosensitive relapsed or refractory disease, despite having primary refractory disease to frontline immunoche- motherapy or an early relapse, can expect durable disease
control with ASCT consolidation. These findings are further supported by durable responses seen in patients assigned to the standard-of-care group of the ZUMA-7 and TRANS- FORM studies, with the former resulting in a median DOR of 8.9 months in patients who had a response (i.e., CR or PR) and the latter reporting a median DOR of 14.5 months (12-month DOR rate, 54.7%) in patients achieving CR.15,17 More favorable survival outcomes were observed in our patients who required only one line of ST and those who achieved CR, with a median PFS of 37.9 months (24-month
Haematologica | 109 July 2024
2190
