
Page 158 - Haematologica Vol. 109 - July 2024
P. 158
ARTICLE - Sovleplenib Syk inhibitor in R/R B-cell tumors Y. Song et al.
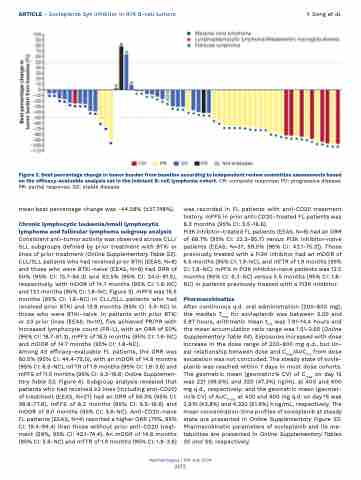
Figure 2. Best percentage change in tumor burden from baseline according to independent review committee assessments based on the efficacy-evaluable analysis set in the indolent B-cell lymphoma cohort. CR: complete response; PD: progressive disease: PR: partial response; SD: stable disease.
mean best percentage change was -44.08% (±37.748%).
Chronic lymphocytic leukemia/small lymphocytic lymphoma and follicular lymphoma subgroup analysis Consistent anti-tumor activity was observed across CLL/ SLL subgroups defined by prior treatment with BTKi or lines of prior treatment (Online Supplementary Table S3). CLL/SLL patients who had received prior BTKi (EEAS, N=8) and those who were BTKi-naive (EEAS, N=8) had ORR of 50% (95% CI: 15.7-84.3) and 62.5% (95% CI: 24.5-91.5), respectively, with mDOR of 14.7 months (95% CI: 1.9-NC) and 13.1 months (95% CI: 1.8-NC; Figure 3). mPFS was 16.5 months (95% CI: 1.6-NC) in CLL/SLL patients who had received prior BTKi and 13.8 months (95% CI: 3.5-NC) in those who were BTKi-naive. In patients with prior BTKi or ≥3 prior lines (EEAS, N=10), five achieved PR/PR with increased lymphocyte count (PR-L), with an ORR of 50% (95% CI: 18.7-81.3), mPFS of 16.5 months (95% CI: 1.6-NC) and mDOR of 14.7 months (95% CI: 1.8-NC).
Among 43 efficacy-evaluable FL patients, the ORR was 60.5% (95% CI: 44.4-75.0), with an mDOR of 14.8 months (95% CI: 6.5-NC), mTTR of 1.9 months (95% CI: 1.9-3.6) and mPFS of 11.0 months (95% CI: 6.3-16.6; Online Supplemen- tary Table S3; Figure 4). Subgroup analysis revealed that patients who had received ≥2 lines (including anti-CD20) of treatment (EEAS, N=27) had an ORR of 59.3% (95% CI: 38.8-77.6), mPFS of 8.2 months (95% CI: 5.5-16.6) and mDOR of 9.0 months (95% CI: 3.6-NC). Anti-CD20-naive FL patients (EEAS, N=4) reported a higher ORR (75%, 95% CI: 19.4-99.4) than those without prior anti-CD20 treat- ment (59%, 95% CI: 42.1-74.4). An mDOR of 14.8 months (95% CI: 5.6-NC) and mTTR of 1.9 months (95% CI: 1.9-3.6)
was recorded in FL patients with anti-CD20 treatment history. mPFS in prior anti-CD20–treated FL patients was 8.3 months (95% CI: 5.5-16.6).
Pi3K inhibitor–treated FL patients (EEAS, N=6) had an ORR of 66.7% (95% CI: 22.3-95.7) versus Pi3K inhibitor-naive patients (EEAS, N=37, 59.5% [95% CI: 42.1-75.3]). Those previously treated with a Pi3K inhibitor had an mDOR of 5.5 months (95% CI: 1.9-NC), and mTTR of 1.9 months (95% CI: 1.8-NC). mPFS in Pi3K inhibitor-naive patients was 12.0 months (95% CI: 6.3-NC) versus 5.5 months (95% CI: 1.8- NC) in patients previously treated with a Pi3K inhibitor.
Pharmacokinetics
After continuous q.d. oral administration (200-800 mg), the median Tmax for sovleplenib was between 3.00 and 5.97 hours, arithmetic mean t1/2 was 7.91-14.4 hours and the mean accumulation ratio range was 1.51-2.65 (Online Supplementary Table S4). Exposures increased with dose increase in the dose range of 200-800 mg q.d., but lin- ear relationship between dose and Cmax/AUC0-t from dose escalation was not concluded. The steady state of sovle- plenib was reached within 7 days in most dose cohorts. The geometric mean (geometric% CV) of Cmax on day 15 was 221 (46.6%) and 320 (47.3%) ng/mL at 400 and 600 mg q.d., respectively; and the geometric mean (geomet- ric% CV) of AUC0-tau at 400 and 600 mg q.d. on day 15 was 2,910 (43.8%) and 4,320 (51.6%) h·ng/mL, respectively. The mean concentration-time profiles of sovleplenib at steady state are presented in Online Supplementary Figure S3. Pharmacokinetic parameters of sovleplenib and its me- tabolites are presented in Online Supplementary Tables S5 and S6, respectively.
Haematologica | 109 July 2024
2172
