
Page 61 - Haematologica July
P. 61
peptides and proteins present at significantly increased con- fold) in children with SCIs compared to controls. Where more
Proteomics of silent cerebral infarction in SCA
trol populations were inherited, using a different sample of adult patients who had undergone brain MRI and a genome-wide genotyping array. Of 359 patients with brain MRIs and MEGAchip data, 199 had SCI and 160 did not. Regions of interest were analysed for the candidate genes identified in the proteomic study; the most signifi- cant genetic variant from each region is shown in Table 4. No genetic variant in the candidate genes was significantly associated with SCI after correcting for multiple testing. A variant in gelsolin was closest to achieving significance (P=0.00029, threshold for significance 0.00009).
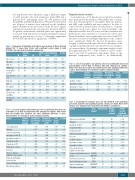
Table 1. Comparison of laboratory and clinical measurements of those with and without SCI. P values from t-tests, with significant results shown in bold (P<0.05), not corrected for multiple comparisons.
Targeted plasma analysis
Concentrations of 92 known neurological biomarkers were measured in the plasma of 54 patients who consent- ed to the study and gave blood samples. Fifty-one patients had MRI scans available and were analysed. In order to control for the potential effect of hydroxyurea, a logistic regression model was fitted for each biomarker; the dependent variable was SCI status, and the biomarker and hydroxyurea were included as covariates in each model. Seven biomarkers were significantly associated with SCI, but after correction for multiple hypotheses none of these were significant (Table 5). Several biomarkers were strongly correlated with each other and a heatmap of the correlation matrix indicated a moderate level of redundan- cy between them. A principal component analysis found that approximately 90% of the variance could be attrib- uted to the first 30 principal components. None of the principal components were found to be differentially
Table 3. List of all peptides and proteins present at significantly decreased concentrations (>0.77 fold) in children with SCIs compared to controls. Where more than one peptide was identified, the most significant difference is given. Concentrations are normalized against standard controls.
Controls
N. mean s.d.
32 11.5 3.17 32 83.4 8.45
P value 0.40
Age (years)
Hb (g/L)
HbF(%)
MCH (pg)
Neutrophils (x109/L)
Reticulocytes (%)
Bilirubin
AST
Creatinine
LDH
Diastolic bp (mmHg)
Systolic bp (mmHg)
Silent cerebral infarction N. mean s.d.
19 12.4 3.82
19 86.1 11.1
18 6.1 3.6 0.049
0.33
32 32 32
27
32 32 32 32 26
26
8.6 5.1 28.0 4.7 4.7 1.6
12.3 3.7
40.5 15.5 57.5 26.0 31.9 9.9 567 135 66.5 6.9
108.6 7.6
19 28.6 19 4.4
15 12.4
19 42.9 19 56.0 19 36.4 18 565 14 66.5
4.0 0.68 1.8 0.55
4.7 0.99
20.5 0.64 19.0 0.84 11.8 0.14 148 0.97 4.9 0.99
Protein
Number Normalized Normalized Fold different concentration concentration change
P value
0.021 0.018 0.035 0.015
peptides in controls
in SCI
0.541 1.09 0.821 1.27
in SCI
0.71 0.63 0.76 0.68
Ig alpha-1 chain
Ig gamma-1 chain
Ig gamma- 3 chain Platelet basic protein
1 0.757 35 1.74 1 1.08
4 1.865
14 115 9.6 0.027
Table 4. Association of candidate genes for SCI identified in the proteomic part of the study. The most significant genetic variants are shown. None of the variants were significant after adjustment for multiple comparisons.
Table 2. List of all
centrations (>1.3
than one peptide was identified, the most significant difference is given. Concentrations are normalized against standard controls.
Gene Chromosome Number Symbol of SNPs analysed
Protein
Alpha-2-macroglobulin
Albumin
Apoliprotein B-100
ComplementC1s C1S 12 360 Complement C3 C3 19 449 Fibrinogen gamma chain FGG 4 23 Gelsolin GSN 9 607
P value
of most significant genetic variant
0.0140 0.0016 0.0587 0.0016 0.0257 0.0258 0.0003 0.2699 0.0609 0.0488 0.0180
0.0495
0.4393 0.0040 0.0233 0.0207
Protein
α-2-antiplasmin
Apolipoprotein A-IV
Apolipoprotein B-100
Complement C1s
Number Normalized Normalized Fold P value different concentration concentration change
A2M 9 431
peptides in controls
in SCI
0.914 0.703 0.832 0.421 0.428 0.565 0.561 1.25 0.577 1.14
1.5
0.625 0.763
in SCI
1.44 1.39 1.38 1.50 1.41 1.34 1.35 1.33 1.40 1.36
1.32
1.34 1.32
ALB 4 89 APOB 2 180
Albumin
3 0.635 1 0.505 7 0.601 7 0.28 1 0.303
0.42 2 0.414 1 0.936 10 0.411 2 0.833
1 1.14
0.004 0.005 0.01 0.0002 0.014 0.014 0.004 0.01 0.00006 0.002
0.006
0.002 0.001
α-2-macroglobulin
Complement C3
Ig alpha-1 chain
Ig gamma-1 chain
Ig gamma-3 chain
Inter-alpha-trypsin inhibitor heavy chain
Pigment epithelium-derived factor
Platelet basic protein Retinol-binding protein 4 Alpha-2-antiplasmin Thrombospondin 4
IGHA1 14 25 IGHG1 14 43 IGHG3 14 26 ITIH1 3 75
PEDF/S 17 117 ERPINF1
PPBP 4 4
RBP4 10 99 SERPINF2 17 70 THBS4 5 387
Fibrinogen g chain
Gelsolin
Inter-α−trypsin inhibitor heavy chain-1
Pigment epithelium- derived factor
Retinol-binding protein 4 3 0.465 Thrombospondin-4 2 0.577
haematologica | 2018; 103(7)
1139
