
Page 49 - Haematologica July
P. 49
Mouse model of sickle cell disease
its ligand, ET-1, in the DRG and peripheral tissue of HbSS mice. Edn1 mRNA (encoding ET1) and ET-1 protein were elevated in HbSS mouse DRG (Figure 5 A, B). Ednra mRNA (encoding ETA receptor) expression in the DRG did not differ between HbAA and HbSS mice, but the level of ETA receptor protein significantly increased in HbSS DRG (Figure 5 A, B). In accordance with previous studies,10,25 ETA receptors were expressed exclusively in the neurons of DRG. Approximately 43% of ETA receptor- labeled neurons are positive for CGRP, 36% for IB4, and only 12% for NF200 (Figure 5 C). Interestingly, the immunostaining for pre-pro ET-1, a precursor of ET-1 pep- tide, was also restricted to DRG neurons (Online Supplementary Figure S9). About 36% of pre-pro ET-1- labeled neurons are positive for CGRP, 56% for IB4, and 7% for NF200 (Figure 5C). The percentage of neurons expressing ETA receptors or pre-pro ET-1 within the DRG of HbSS mice was 45% and 32%, respectively, higher than those in the HbAA DRG (Figure 5 D, E). Unexpectedly, there was no significant difference in hind- paw expression of ET-1 or ETA receptors between HbAA and HbSS mice (Figure 5F).
Effect of ETA receptor inhibition on Nav1.8 expression and channel activity in SCD DRG
Previous studies have shown that ET-1 can alter the activity of TTX-R sodium channels in rat DRG neurons.26 Nav1.8, a TTX-R sodium channel in DRG, participates in
chronic inflammatory pain genesis.27 We first determined if Nav1.8 expression differed between HbAA and HbSS DRG. The levels of Scn10a mRNA (encoding Nav1.8) and Scn11a mRNA (encoding Nav1.9, another TTX-R sodium channel) were elevated in HbSS DRG (Figure 6A). The amount of Nav1.8 protein and the percentage of Nav1.8- positive neurons were also increased in HbSS DRG (Fig. 6 B, C). Four days of hindpaw ABT-627 administration abol- ished the increase in Nav1.8 protein in HbSS DRG (Figure 6 B), indicating that increased Nav1.8 requires ETA recep- tor activation in SCD (HbSS) DRG.
Furthermore, we analyzed Nav1.8 activity in HbSS DRG neurons. Whole cell voltage-clamp recordings were performed in freshly disassociated small DRG neurons since Nav1.8 is expressed predominantly in small DRG neurons.28 Neurons were held at -60 mV, given a depolar- izingstepat50msfrom-55mVto+40mVwitha5mV increment (Figure 7A). Under this protocol with the pres- ence of 500 nM TTX, Nav1.9 current was inhibited to keep the Nav1.8 current integrated.29 Nav1.8 current den- sity from the HbSS DRG neurons significantly increased compared to HbAA DRG neurons (Figure 7A, B). Bilateral subcutaneous ABT-627 administered daily over 4 days prior to DRG collection produced a larger reduction in Nav1.8 current density in HbSS DRG compared to HbAA DRG (Figure 7A, B). When tested at -15 mV, ABT-627 reduced Nav1.8 current by approximately 300 pA in HbSS DRG neurons, with no change in the HbAA DRG neurons
ABC
D
EF
G
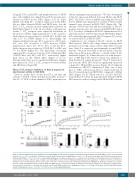
Figure 2. Townes HbSS DRG neurons display increased excitability and spontaneous activity. (A and B) Resting membrane potential (RMP, A) and current threshold for pulse (Ithreshold, B). n = 24 large, 22 medium, and 21 small neurons from the HbAA group (7 mice). n = 25 large, 23 medium, and 25 small neurons from the HbSS group (6 mice). **P<0.01 vs. the corresponding HbAA group. (C) Representative trace of evoked action potentials in small DRG neurons. (D) Numbers of evoked action potentials (APs) in large, medium, and small DRG neurons from the HbAA and HbSS groups after application of different currents as indicated. Numbers of the recorded neurons are the same as in A. *P<0.05, **P<0.01 vs. the same stimulation intensity in the HbAA group. (E) Representative trace of spon- taneous activity in small DRG neurons from the HbAA and HbSS groups. (F and G) Percentage of DRG neurons that had spontaneous activity (SA, F) and frequency of spontaneous activity (G). n = 23 large, 22 medium, and 25 small DRG neurons for the HbAA group (7 mice). n = 26 large, 25 medium, and 22 small DRG neurons from the HbSS group (6 mice). *P<0.05, **P<0.01 vs. the corresponding HbAA group.
haematologica | 2018; 103(7)
1127
