
Page 38 - Haematologica July
P. 38
1116
Y. Zhou et al.
A
B
CD
E
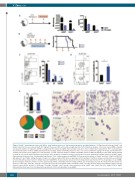
Figure 4. Setd2Δ/Δ hematopoietic stem cells (HSCs) show reduced quiescence, but increased apoptosis and differentiation. (A) Experimental strategy: Setd2f/f and Setd2f/f/Vav1-Cre mice were injected with 150 mg/kg 5-fluorouracil (FU) and sacrificed eight days later (left). Statistical analyses of the bone marrow (BM) cellularity and absolute number of long-term (LT)-HSCs analyzed by flow cytometry (right). Representative data were from 3 independent experiments. (N=6 each genotype; mean±Standard Error of Mean (SEM)]. (B) Experimental strategy: Setd2f/f and Setd2f/f/Vav1-Cre mice were injected with 150 mg/kg 5-FU weekly and monitored for survival (left). Survical curve (right) (n=6 each genotype). (C) Flow cytometry analysis of Setd2f/f and Setd2f/f/Vav1-Cre BM cells with Ki-67 and 7-AAD. Gating strategy is shown in one representative FACS blots per genotype (left). Summary of statistical analyses showed decreased G0 distribution in Setd2f/f/Vav1-Cre LT-HSCs (right). Representative data were from 3 independent experiments. (N=6 each genotype; mean±SEM). (D) Flow cytometry analysis of Setd2f/f and Setd2f/f/Vav1-Cre BM cells with Annexin V and 7-AAD. Gating strategy is shown in one representative FACS blots per genotype (left). Summary of statistical analyses showed increased distribu- tion into AnnexinV positive fraction in Setd2f/f/Vav1-Cre SLAM-HSCs. Representative data were from 3 independent experiments. (N=6 each genotype; mean ± SEM). (E) The bar figure shows the number of clones generated by Setd2f/f and Setd2f/f/Vav1-Cre single LT-HSCs per 60-well plate (top left). Pie chart shows the relative fre- quencies of 4-lineage, 3-lineage, 2-lineage, and 1-lineage clones generated from Setd2f/f and Setd2f/f/Vav1-Cre single LT-HSCs (bottom left). Wright’s stained cytospin showed representative pictures of 4-lineage, 3-lineage, 2-lineage, and 1-lineage clones generated from Setd2f/f and Setd2f/f/Vav1-Cre single LT-HSCs (right). Representative data were from 2 independent experiments. (N=4 each genotype; mean±SEM).
haematologica | 2018; 103(7)
