
Page 155 - Haematologica July
P. 155
Labeling index in light chain amyloidosis
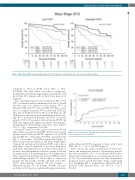
Figure 3. Mayo Stage 2012. Survival by Mayo Stage 2012. PCPI: plasma cell proliferation index; OS: overall survival; N: number.
compared to the Low PCPI cohort (53% vs. 36%; P=0.0006). This may reflect our policy of giving pre- transplantation chemotherapy induction in patients with more than 10% plasma cells in their bone marrow at diagnosis.
Data regarding response were available in 501 of 513 (98%) of patients and are summarized in Table 2. Overall response rate was similar in both groups (87% in Elevated PCPI and 87% in Low PCPI; P=0.86) as were rates of complete response (40% in Elevated PCPI and 44% in Low PCPI; P=0.44). In the Low PCPI group, the ORR was not affected by pre-transplantation chemother- apy: 86% in untreated patients and 90% in treated patients (P=0.4). For patients with an Elevated PCPI, the ORR was significantly higher in patients receiving pre- transplantation chemotherapy than those who did not (92% vs. 74%, respectively; P=0.003).
Median PFS and OS for the entire cohort were 84 and 126 months, respectively. Both PFS and OS were lower in patients with an Elevated PCPI compared to Low PCPI (median PFS 44 vs. 95 months, P<0.0001, and median OS 102 vs. 143 months, P=0.0003, respectively) (Figure 1). Hematologic response (Figure 2) and Mayo Stage (Figure 3) predicted survival. In the Elevated PCPI cohort, those with Mayo Stage IV appeared to do better than those with Mayo Stage III; however, we believe this is likely to be due to the small numbers in the two groups (n=20 and 22, respectively). Chemotherapy prior to transplantation did not impact OS in either cohort (Low PCPI Pre-ASCT chemotherapy median OS 143 months vs. Untreated median OS 142 months, P=0.65, and PCL over 0 Pre- ASCT chemotherapy median OS 102 months vs. Untreated median OS 114 months, P=0.86). All-cause mortality at 100 days was significantly higher in patients
Figure 4. Day 100 all-cause mortality. PCPI: plasma cell proliferation index; ASCT: autologous stem cell transplant.
with an Elevated PCPI compared to those with a Low PCPI (10.3% vs. 4.3%; P=0.008) (Figure 4).
Table 3 shows the results for predictors of OS by uni- variate and multivariate analysis. On univariate analysis age, male sex, BMPCs 10% or over, Elevated PCPI, Mayo Stage, and conditioning dose were all prognostic factors for OS. On multivariate analysis the only independent prognostic factors for OS were Mayo Stage, conditioning dose (melphalan 200 vs. melphalan less than 200) and an Elevated PCPI (Hazard Ratio 1.5, 95%CI: 1.1-2.1; P=0.02).
haematologica | 2018; 103(7)
1233
