
Page 100 - Haematologica July
P. 100
1178
Y. Heshmati et al.
ABC
DE
FGH
I
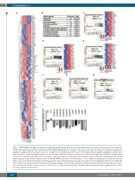
Figure 7. CHD4 inhibition in AML cells induces an expression profile linked to MYC and cell cycle progression. A. Heatmap of 100 genes with most significant changes in gene expression of THP-1 cells transduced with shRNA targeting CHD4, or a negative control vector, 72 hours post transduction. The data represent clus- tering of the individual experiments. B. List of the ten most significant KEGG gene set pathways correlating to gene expression changes resulting from shRNA-based inhibition of CHD4, relative to a negative control vector, in THP-1 cells. C-H. Enrichment plots of gene set enrichment analysis (GSEA) of mRNA gene expression pro- filing in response to CHD4 knockdown in THP-1 cells, demonstrating significant normalized enrichment score (NES) between MYC target V2 (Figure 7C), MYC targets V1 (Figure 7D), and E2F targets (Figure 7E), or to S phase (Figure 7F), synthesis of DNA (Figure 7G), assembly of the pre-replicative complex (Figure 7H). The bar charts represent the top ranked correlations in the predefined MSigDB: H hallmark collections (Figure 7C-E), or significant correlations to CP Reactome collection (Figure 7F-H). The heatmap on the right in C-E shows the relative level of gene expression (red = high, blue = low) of the most significant genes in the leading edge subset. I. Bar charts show real time PCR analysis of mRNA levels of genes showing changes in RNA-Seq of THP-1 cells, after shRNA-based knockdown of CHD4, rel- ative to control cells transduced with vectors expressing scrambled shRNA, at 72 hours post transduction. mRNA levels were normalized to UBC. The data is repre- sented as the mean ±S.E.M., *P<0.05, **P<0.01, ***P<0.005, ****P<0.001 (unpaired t-test), n=3. KEGG: Kyoto encyclopedia of genes and genomes; Sc: scram- ble control; FDR: false discovery rate.
haematologica | 2018; 103(7)
