
Page 89 - Haematologica June
P. 89
Dexamethasone in AML
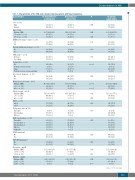
Table 1. Characteristics of the 160 acute myeloid leukemia patients with hyperleukocytosis.
Characteristics
Sex–n.(%) Male Female
Age – years
Median (IQR) <60 years – n. (%) ≥60 years – n. (%)
ECOG performance status – n. (%) 0-1
2-4
Extramedullary involvement – n. (%) No
Yes
AML status – n. (%)
De novo
Secondary
Leukostasis – n. (%) No
Central nervous system
Lung
Central nervous system and lung
Infection at diagnosis – n. (%) No
Yes
White blood cell count – x109/L Median (IQR)
<100 – n. (%)
≥100 – n. (%)
Platelet count – x109/L Median (IQR) <50–n.(%) ≥50–n.(%)
CD56 – n. (%) ≤20%
>20%
Cytogenetic risk – n. (%) Favorable
Intermediate
Adverse
ELN classification – n. (%) Favorable
Intermediate-1 Intermediate-2
Adverse
Unknown$
NPM1 mutations¶ No
Yes
FLT3-ITD mutations¶ No
Yes
Creatinine - mg/dL Median (IQR) <1.36 – n. (%) >1.36– n. (%)
Bilirubin - mg/dL Median (IQR) ≤1.47 – n. (%) >1.47 – n. (%)
No dexamethasone n=100 (62.5%)
56 (56.0) 44 (44.0)
60.7 (48.3-68.5) 47 (47.0)
53 (53.0)
60 (77.9) 17 (22.1)
38 (46.3)
44 (53.7)
81 (81.0) 19 (19.0)
84 (84.0) 2 (2.0) 10 (10.0) 4 (4.0)
78 (80.4) 19 (19.6)
86.3 (66.1-115.5) 62 (62.0)
38 (38.0)
54.5 (35.0-85.5) 44 (44.0)
56 (56.0)
71 (78.9)
19 (21.1)
8 (8.0) 79 (79.0) 13 (13.0)
23 (23.0) 32 (32.0) 21 (21.0) 13 (13.0) 11 (11.0)
27 (39.7) 41 (60.3)
33 (48.5)
35 (51.5)
1.05 (0.89-1.25) 82 (82.0)
18 (18.0)
0.54 (0.38-0.79) 95 (95.0)
5 (5.0)
Dexamethasone n=60 (37.5%)
27 (45.0) 33 (55.0)
58.8 (50.5-66.5) 33 (55.0)
27 (45.0)
31 (56.4) 24 (43.6)
25(42.4)
34 (57.6)
55 (91.8) 5 (8.3)
34 (56.7) 9 (15.0) 12 (20.0) 5 (8.3)
46 (76.7) 14 (23.3)
119 (90.7-181.4) 21 (35.0)
39 (65.0)
49.5 (24.5-72.0) 30 (50.0)
30 (50.0)
44 (75.9)
14 (24.1)
7 (11.7) 48 (80.0) 5 (8.3)
17 (28.3) 25 (41.7) 12 (20.0) 5 (8.3)
1 (1.7)
17 (35.4) 31 (64.6)
20 (41.7)
28 (58.3)
0.91 (0.71-1.24) 50 (83.3)
10 (16.7)
0.53 (0.35-0.79) 55 (94.8)
3 (5.2)
P
0.178
0.244
0.327 0.008
0.640
0.067
<0.001
0.576
<0.001
<0.001
0.062 0.461
0.666
0.530
0.155
0.639
0.465
0.029 0.830
0.649
1.000
All patients n=160 (100%)
83 (51.9) 77 (48.1)
60.1 (49.2-67.3) 80 (50.0)
80 (50.0)
91 (68.9) 41 (31.1)
63 (44.7)
78 (55.3)
136 (85.0) 24 (15.0)
118 (73.8) 11 (6.9) 22 (13.8) 9 (5.6)
124 (70.9) 33 (21.0)
97.6 (71.0-142.6) 83 (51.9)
77 (48.1)
52.0 (31.0-77.0) 74 (46.3)
86 (53.8)
115 (77.7)
33 (22.3)
15 (9.4) 127 (79.4) 18 (11.3)
40 (25.0) 57 (35.6) 33 (20.6) 18 (11.3) 12 (7.5)
44 (37.9) 72 (62.1)
53 (45.7)
63 (54.3)
1.01 (0.83-1.24) 132 (82.5) 28 (17.5)
0.53 (0.36-0.79) 150 (94.9)
8 (5.1)
haematologica | 2018; 103(6)
continued on the next page
991
