
Page 53 - Haematologica June
P. 53
RPL15 mutations in DBA
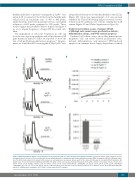
healthy individual or patients carrying the p.Tyr81* vari- ant in eL15. As expected, the LCLs from the healthy indi- vidual reveal an equivalent ratio of 40S to 60S peaks, while the LCLs derived from patients reveal a substantial reduction of 60S peaks compared to 40S peaks. These results suggest the pre-rRNA defects depicted in Figure 3 go on to impair biogenesis of large 60S ribosomal sub- units.
The impairment of ribosome biogenesis in cells can slow the rate of protein synthesis and cell proliferation. RP gene mutations linked to DBA are reported to slow the rate of cell proliferation and increase apoptosis.36 In agree- ment, we found that LCLs carrying the eL15 p.Tyr81* vari-
ant proliferated far more slowly than healthy control LCLs (Figure 4B). Moreover, measurement of de novo protein synthesis by Click-iT® labeling analysis revealed a severe reduction in the synthesis rate of LCLs carrying the eL15 variant (Figure 4C and Online Supplementary Figure S4).
Erythroid cell culture assays of primary RPL15 c.242dupA cells reveal severe proliferation defects, differentiation delays, and TP53-related apoptosis
Erythroid cell culture assays show that hematopoietic progenitor cells can reveal reduced proliferation rates, delayed differentiation, and increased TP53-induced apoptosis in a manner that is largely dependent on which
A
B
C
Figure 4. RPL15 mutations impair cell proliferation, de novo protein synthesis, and 60S ribosomal subunit formation. (A) Representative (n=3) polysome profiles of lymphoblastoid cell line (LCL) extracts derived from healthy individuals or individuals with Diamond-Blackfan anemia (DBA) carrying the RPL15 c.242dupA muta- tion. The 40S small subunit, 60S subunit, 80S monosome, and polysomes are labeled. Arrows point to the reduced 60S peaks in cells with RPL15 mutations. (B) Growth curve of LCLs derived from individuals with DBA or healthy controls over six days. Standard Deviations for healthy control-1 cells on days 1-5 are 2.6e4, 1.5e4, 3.8e4, 6.9e4, 1.0e5; healthy control-2 cells are 8.8e3, 3.0e4, 2.9e4, 7.5e4, 8.5e4; RPL15 c.242dupA-1 are 2.1e4, 1.9e4, 1.6e4, 2.3e4, 2.2e4; and RPL15 c.242dupA-2 are 9.5e3, 1.7e4, 1.7e4, 2.2e4, 2.5e4. (C) Measurement of the amount of de novo protein synthesis in 30 minutes in LCLs derived from healthy indi- viduals or a DBA patient carrying the eL15 Tyr81* variant using Click-iT® analysis.
haematologica | 2018; 103(6)
955
