
Page 150 - Haematologica June
P. 150
F.E. Davies et al.
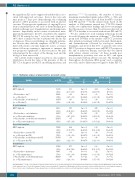
the signal from FLs can be suppressed and that this is asso- ciated with improved outcomes. Even at the very early time point of 7 days post chemotherapy, the continuing presence of PET positivity is associated with an adverse outcome. The prognostic significance of ongoing FL posi- tivity is maintained post one cycle of chemotherapy, post induction therapy, post transplantation, and during main- tenance. Importantly, in the context of induction, trans- plant and maintenance, the 28% of patients who suppress PET-CT FL activity by day 7 or by the end of induction (46%) have a similar outcome to patients who had no FLs at diagnosis. These novel findings are clinically informa- tive because they shift the emphasis of PET-CT assess- ment of FLs from a one-time diagnostic scan to a scenario where follow-up scanning is important to interpret the true prognostic significance of these lesions for the indi- vidual patient in the context of the therapy used and the biology of their cancer cells.
The current results expand on previous data analyses which have shown the value of the presence of FLs on PET-CT at diagnosis in MGUS, smoldering myeloma, and
Table 5. Multivariate analyses of progression-free and overall survival.
myeloma.3,5-7,11,19-21 In myeloma, the number of lesions, maximum standardized uptake values (SUVmax), TLG, and metabolic tumor volume have all been shown to correlate with PFS and OS.3-8,11 In the current study, based on the analysis of 596 patients entered into TT4-TT6 clinical studies, we confirm these findings and show convincingly that the presence of more than 3 focal lesions detected on PET-CT at baseline is associated with adverse PFS and OS.
We also clarify how such scanning technology should be used following the initiation of therapy.3-5,8 The Italian group used SUVmax as the marker of PET-CT positivity after induction treatment with bortezomib, thalidomide, and dexamethasone followed by autologous tandem transplant, and showed that 63% of patients who were PET-CT positive at diagnosis were still PET-CT positive at the end of induction therapy, and that this was linked with adverse clinical outcome.8 At three months post transplantation, positivity was seen in 35%, and again was associated with an adverse outcome. The Intergroup Francophone du Myelome (IFM) group4 used a combina- tion of FLs and/or diffuse marrow signal to define PET-CT
Progression-free survival Overall survival Variable n/N(%) HR P HR P
AtDay7
GEP 70 high risk
0FLatbaseline+day7
(vs.>0FLatday7)
>0 FL at baseline, resolved by day 7
(vs.>0FLatday7) At end of induction GEP 70 high risk
0 FL at baseline + end of induction
(vs. >0 FL at end of induction)
>0 FL at baseline, resolved by end of induction
(vs. >0 FL at end of induction) At post-first transplant
GEP 70 high risk
0 FL at baseline + post-first TX
(vs. >0 FL at post-first TX)
>0 FL at baseline, resolved by post-first TX
(vs. >0 FL at post-first TX) At maintenance
GEP 70 high risk
0 FL at baseline + maintenance
(vs. >0 FL at maintenance)
>0 FL at baseline, resolved by maintenance
(vs. >0 FL at maintenance)
(95% CI)
3.91
(2.70, 5.66) 0.41
(0.27, 0.63) 0.41
(0.28, 0.62)
3.45
(2.43, 4.90) 0.72
(0.47, 1.11) 0.67
(0.45, 0.98)
4.94
(3.15, 7.77) 0.36
(0.21, 0.62) 0.36
(0.22, 0.60)
4.71
(2.98, 7.46) 0.32
(0.16, 0.68) 0.47
(0.24, 0.90)
R2 (95%CI) R2
4.64
(2.99, 7.19) 0.31
(0.16, 0.58) 0.43
(0.26, 0.72)
4.46
(2.93, 6.78) 0.78
(0.45, 1.35) 0.80
(0.50, 1.29)
6.19
(3.68, 10.40) 0.43
(0.20, 0.91) 0.46
(0.23, 0.90)
6.20
(3.59, 10.70) 0.22
(0.09, 0.52) 0.31
(0.15, 0.65)
50/336
(15%) 82/240
(34%) 96/254
(38%)
62/300
(21%) 81/207
(39%) 126/219
(58%)
37/287
(13%) 91/126
(72%) 161/196
(82%)
35/223
(16%) 64/81
(79%) 142/159
(89%)
P≤0.001, R2=20.7%
P≤0.001, R2=3.5%
P≤0.001, R2=34.2%
P≤0.001, R2=47.5%
P≤0.001, R2=34.2%
P=0.001, R2=47.5%
P≤0.001, R2=39.3%
P=0.377, R2=40.1%
P=0.354, R2=40.1%
P≤0.001, R2=40.8%
P=0.026, R2=45.0%
P=0.024, R2=45.0%
P≤0.001, R2=26.1%
P=0.141, R2=28.5%
P=0.039, R2 =28.5%
P≤0.001, R2=25.3%
P≤0.001, R2=34.7%
P≤0.001, R2=34.7%
P≤0.001, R2=28.8%
P=0.003, R2=34.4%
P=0.022, R2=34.4%
P≤0.001, R2= 43.8%
HR: Hazard Ratio; 95%CI: 95% Confidence Interval; P-value from Score c2 test in Cox Regression. R2: R-squared using method by O’Quigley and Xu. Multivariate results not statis- tically significant at 0.05 level.All univariate P-values reported regardless of significance.Multivariate model uses stepwise selection with entry level 0.1 and variable remains if the 0.05 level is met.A multivariate P-value greater than 0.05 indicates variable forced into model with significant variables chosen using stepwise selection.
P≤0.001, R2=52.9%
P=0.002, R2=52.9%
1052
haematologica | 2018; 103(6)
