
Page 146 - Haematologica June
P. 146
F.E. Davies et al.
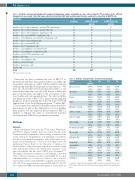
Table 1. Positron emission tomography with computed tomography sample availability of cases entered into the TT4-6 studies at the different timepoints of assessment. Note that some patients did not have GEP data available and therefore could not be classified by GEP70 risk.
Time points
Baseline + day 7 + end of induction + post-first TX + maintenance
Baseline + day 7 + end of induction + post-first TX only Baseline + day 7 + end of induction + maintenance only Baseline + day 7 + post-first TX + maintenance only
Baseline + end of induction + post-first TX + maintenance only Baseline + day 7 + end of induction only
Baseline + day 7 + post-first TX only
Baseline + day 7 + maintenance only
Baseline + end of induction + post-first TX only Baseline + end of induction + maintenance only Baseline + post-first TX + maintenance only Baseline + day 7 only
Baseline + end of induction only
Baseline + post-first TX only
Baseline + maintenance only
Baseline only
Total
GEP: gene expression profile.
Previously we have evaluated the role of PET-CT at presentation and have demonstrated that it can refine the assessment of prognosis, with both the number and size of FLs giving clinically useful prognostic information.3-7 We have also shown that total lesion glycolysis (TLG), a cal- culation that takes into account total disease volume and glucose metabolism, can improve the assessment of dis- ease burden and outcome prediction.11 In order to further determine the value of PET-CT for disease monitoring and prognosis, we have utilized data collected in the TT4-TT6 clinical trials of our Total Therapy program,12,13 where PET- CT assessment was included both at presentation and dur- ing response as part of the clinical protocol. In a prelimi- nary analysis, we also explored the potential for PET-CT analysis to enhance the value of conventional response assessment and MRD flow cytometry assessment.
Methods
Patients
Of the 606 patients entered into the TT4-6 studies, 596 patients had PET-CT analysis available and were included in this study. Treatment included combination chemotherapy as induction with double autologous transplantation, post-transplant consolidation, and three years planned maintenance with lenalidomide, borte- zomib, and dexamethasone.12,13 Protocols were approved by the Institutional Review Board of the University of Arkansas for Medical Sciences. All patients signed informed consent in keeping with institutional, federal, and international guidelines. Gene expression analysis and risk status (GEP70) were determined.14,15 The number of patients for analysis at each landmark is shown in Table 1. The most common reason for a missing PET-CT was lack of health insurance to cover the costs of the test. The 3-year sur- vival estimates with corresponding 95% confidence intervals were 68% (65, 72) for progression-free survival (PFS) and 82% (78, 85) for overall survival (OS). Median follow up was 5.1 years (Table 2).
N.
of patients
67
49 29 42 32 58 33 11 21 14 25 60 46 28 15 66 596
N.
of GEP70 low-risk patients
41
40 20 38 23 40 31 9 15 9 23 46 31 27 14 60 467
N.
of GEP70 high-risk patients
16
4 6 1 8 12 1 0 5 3 1 7 6 0 0 1 71
Table 2. Patients’ characteristics, overall and by protocol.
Factor
Age ≥ 65 years IgA isotype
Female
White
Albumin < 3.5 g/dL
βM≥ 3.5mg/L 2
β M>5.5mg/L 2
CRP ≥8 mg/L Creatinine ≥2 mg/dL
Hb <10 g/dL
LDH ≥190 U/L
Cytogenetic
abnormalities ISS Stage 1
ISS Stage 2
ISS Stage 3
All TT4 TT5 TT6 patients
198/596 (33%) 109/588
(19%) 238/596 (40%) 500/596 (84%) 248/595 (42%) 321/593 (54%) 152/593 (26%) 160/594 (27%) 29/595 (5%) 239/595 (40%) 121/595 (20%) 258/590 (44%) 193/593 (33%) 248/593 (42%) 152/593 (26%)
110/376 (29%) 65/370
(18%) 143/376 (38%) 321/376 (85%) 166/376 (44%) 194/374 (52%) 98/374 (26%) 99/375 (26%) 17/376 (5%) 151/376 (40%) 53/376 (14%) 148/370 (40%) 121/374 (32%) 155/374 (41%) 98/374 (26%)
21/72 67/148 (29%) (45%) 20/72 24/146
(28%) (16%) 31/72 64/148 (43%) (43%) 61/72 118/148 (85%) (80%) 37/72 45/147 (51%) (31%) 56/72 71/147 (78%) (48%) 31/72 23/147 (43%) (16%) 28/72 33/147 (39%) (22%) 7/72 5/147
(10%) (3%)
46/72 42/147
(64%) (29%) 28/72 40/147 (39%) (27%) 48/72 62/148 (67%) (42%) 11/72 61/147 (15%) (41%) 30/72 63/147 (42%) (43%) 31/72 23/147 (43%) (16%)
1048
n.: number; β2M: beta-2-microglobulin; CRP: C-reactive protein; Hb: hemoglobin; LDH: lactate dehydrogenase; ISS: International Staging System; IgA: immunoglobu- lin A.
haematologica | 2018; 103(6)
