
Page 112 - Haematologica June
P. 112
L. Trentin et al.
AB
Figure 6. Reactive oxygen species (ROS) activity is associated with different cell cycle phases and cycling potential. (A) Low ROS activity in TTLshort/high proliferating (n=8) compared to TTLlong/slow proliferating (n=8) acute lymphoblastic leukemia samples: fold-change difference, (mean ± Standard Deviation) measured by flow cytometry. (B) Low ROS activity in sorted G1blow annotated primograft leukemia cells compared to G2/M cells measured by flow cytometry. TTLshort: Time To Leukemia short; TTLlong: Time To Leukemia long; ctrl: control.
A
B
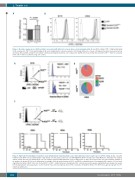
C
Figure 7. High leukemia initiating-cell activity in acute lymphoblastic leukemia (ALL) is associated with low reactive oxygen species (ROS) activity. (A) ALL cells with low ROS levels (ROSlow) are predominantly in early G0/G1 cell cycle phases, whereas cells with high ROS (ROShigh) include later S-G2/M phases. Simultaneous analysis of ROS activity and cell cycle distribution; cell cycle analysis in gated subpopulations of low or high (lower or upper 15%) ROS levels; one representative example of six analyses is shown. (B) Cell cycle distribution according to flow cytometry analysis in ROSlow and ROShigh subpopulations of 6 primograft ALL samples. (C) Increased engraftment activity of ROSlow ALL cells. Sorted ROShigh or ROSlow subfractions were transplanted (105 cells/mouse) and leukemia engraftment was analyzed as weeks from transplantation until appearance of ≥1% huCD19+ ALL cells in peripheral blood of the recipients. N=4 (ID03, ID04), n=6 (ID06) mice/group, log-rank test; P= statistical significance.
1014
haematologica | 2018; 103(6)
